

Volume 11, Issue 2 (June 2024)
J. Food Qual. Hazards Control 2024, 11(2): 94-104 |
Back to browse issues page


Ethics code: 0000
Download citation:
BibTeX | RIS | EndNote | Medlars | ProCite | Reference Manager | RefWorks
Send citation to:


BibTeX | RIS | EndNote | Medlars | ProCite | Reference Manager | RefWorks
Send citation to:
Öztürk Altuncevahir İ, Özkul Erdoğan E, Yücesoy S. Evaluation nutrients of Turkish Snack Bars Based on Labeling and Web Page Information: A Qualitative Research. J. Food Qual. Hazards Control 2024; 11 (2) :94-104
URL: http://jfqhc.ssu.ac.ir/article-1-1157-en.html
URL: http://jfqhc.ssu.ac.ir/article-1-1157-en.html


Bahçeşehir University, Faculty of Health Sciences, Department of Nutrition and Dietetics, İstanbul, Türkiye , ilaydahaj@gmail.com
Full-Text [PDF 698 kb]
(1423 Downloads)
| Abstract (HTML) (1714 Views)
Table 1: Nutritional composition of bars (n=49)
SD=Standart Deviation
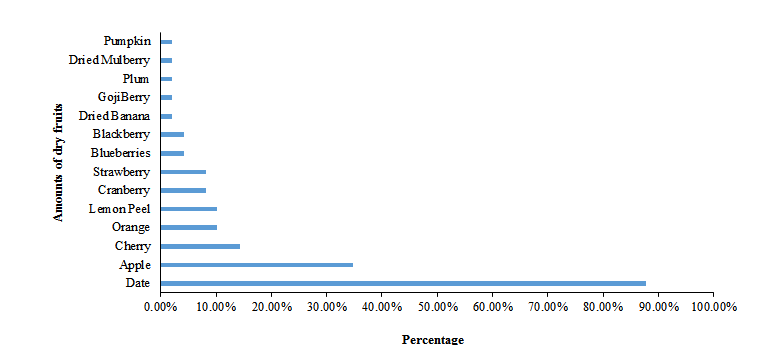
Table 2: Contents of dried fruits and products derivatived in snack bars
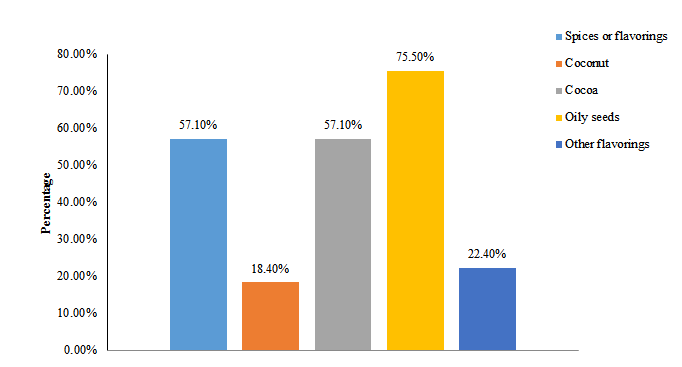
Table 3: Contents of oil seeds, cocoa, coconut, spices, and sweeteners
Table 4: Other ingredients used in bars (%)
Table 5: Nutritional value comparison of snack bars’ brands
SD=Standart Deviation
* Insufficient sample size was not included in the analysis Kruskal-Wallis Test
Full-Text: (164 Views)
Evaluation nutrients of Turkish Snack Bars Based on Labeling and Web Page Information: A Qualitative Research
İ. Öztürk Altuncevahir ** , E. Özkul Erdoğan, S. Yücesoy
Bahçeşehir University, Faculty of Health Sciences, Department of Nutrition and Dietetics, İstanbul, Türkiye
HIGHLIGHTS:
İ. Öztürk Altuncevahir **
Bahçeşehir University, Faculty of Health Sciences, Department of Nutrition and Dietetics, İstanbul, Türkiye
- The study highlights the importance of optimizing transportation practices in the food industry to achieve environmental sustainability.
- Use of local ingredients like hazelnuts and almonds reduces food miles and environmental impacts.
- Optimized transport practices in food industry, e.g., date and fig transport, enhance sustainability.
- Future research needs a comprehensive approach, covering more products and supply chain analyses.
- Study insights aid consumers and authorities in making informed, sustainable food choices and policies.
| Article type Original article |
ABSTRACT Background: Snack bars, a globally popular food category, contain a diverse variety of ingredients and appeal to different dietary preferences. Even though snack alternatives are gaining prominence as viable options for promoting healthy dietary patterns, the composition of certain snacks may pose sustainability-related concerns and effects on environment. This study investigates the energy and nutrient composition of fruit-based snack bars, with a focus on sustainable practices, and the significant inclusion of dates and nuts in production. Methods: Between 10 and 25 July 2023, 49 healthy bars from 12 companies, accessible in five supermarkets, underwent a comprehensive analysis. The researchers visited selected supermarkets, identified the products on the shelves, and collected information on the contents from the labels. The label information was then cross-referenced with the brands' websites. The average values of energy, protein, total fat, saturated fat, carbohydrate, fiber, sugar, and salt contents of 100 g samples of the products were assessed. Group proportions were investigated through the Chi-square test. As comparisons involving numerical variables failed to meet the assumption of normal distribution, independent comparisons were performed using the Kruskal-Wallis test for more than two groups and Mann-Whitney U test for two groups. The significance level was set at p<0.05. Results: Dried fruits, particularly date and their derivatives, are the most prominently featured ingredients (87.8%) of the nutritious snacks, followed by other dried fruits containing apple, cherry, and orange. Oily seeds are the most preferred additional ingredient (75.5%), followed by cocoa (57.1%), spices (57.1%), sweeteners, and coconut. Almonds are the most preferred variety among nuts (36.7%). Other ingredients frequently utilized in bars, such as chickpea flour and chicory root fiber. It is noteworthy that, several snack bars were including multiple ingredients simultaneously whereas others lacked certain ingredients entirely. Furthermore, combination of those ingredients were discovered to be prevalent in various snack bars. Conclusion: In conclusion, this research provides valuable insights for consumers and industry stakeholders, guiding them towards choices aligned with nutritional preferences and supporting environmental and economic sustainability. © 2024, Shahid Sadoughi University of Medical Sciences. This is an open access article under the Creative Commons Attribution 4.0 International License. |
|
| Keywords Snacks Food Supply Nuts Fruit |
||
| Article history Received: 11 Dec 2023 Revised: 5 Apr 2024 Accept: 20 Jun 2024 |
||
To cite: Öztürk Altuncevahir İ., Özkul Erdoğan E., Yücesoy S. (2024). Evaluation nutrients of Turkish snack bars based on labeling and web page ınformation: a qualitative research. Journal of Food Quality and Hazards Control. 11: 94-104.
Introduction
Introduction
In recent years, there has been an increasing interest among individuals in adopting healthier eating habits. This indicates that consumed food items are notexclusively consumed for their nutritional value (Sharafi et al., 2023). Additionally, efforts are being made to enrich the properties of food items for the preservation and enhancement of health (Abdi-Moghadam et al., 2023). Sweet taste is dominant among healthy alternatives. Cochran et al. (2021) reported that 45% of consumers in the United States actively prefer beverages containing natural sweeteners and sugar-free products. The global market for low-sugar products has grown by 17% between 2014 and 2018, according to Singh et al. (2020). The increasing awareness of nutritional allergies and intolerances has highlighted the need to diversify product offerings. However, with the growing awareness of healthy eating, these product alternatives are also expected to be healthy (Gargano et al., 2021). Consumers' needs are altering in the snack market, and producers are meeting the demands of consumers searching for healthier ingredients and new flavors, such as fruit and grain bars.
Snack bars are pre-mixed and compressed food products that are presented to consumers in cut and bar form. Due to their shape and content properties, these bars are conveniently portable and ready to be consumed. The utilization of diverse ingredients in creating various bar flavors provides consumers with different alternatives, catering to their tastes, and serving as a beneficial means of consuming healthy snacks without getting bored of consuming the identical product. Fruit-based snack bars are among the most preferred options as they combine the provision of vitamins, minerals, and other beneficial components defined as daily requirements, offering a healthier alternative to simple sugars (Kosicka-Gębska et al., 2022).
The food miles approach simplifies the examination of environmental effects associated with carbon emissions from food consumption. In the United States, the food sector accounts for 14.4% of total energy consumption, with 0.6% attributed to food-related transportation, 2.0% to agriculture, and 4.1% to household kitchen appliances (Glavič, 2021). In the assessment of global energy consumption from farm to fork, it isdemonstrated that 20% of greenhouse gas emissions stem from food transportation, as highlighted in the EU farm to fork strategy report in 2023. Furthermore, the processing, packaging, and selling of food necessitate an expenditure of energy approximately ten times that used in food-related transportation (European Comission, 2023). In the upcoming years, food-related energy consumption is expected to intensify. This is illustrated by the fact that, on average, the food consumed in the United States covers a distance over 8,000 km from farm to table. Additionally, the increased utilization of air transportation, especially for diverse products such as agricultural goods, to facilitate 'just-in-time' delivery, is highlighted as a significant factor contributing to overall emissions associated with transportation (Afrouzi et al., 2023).
The aim of this research is to evaluate the contents of sweet bars accessible in chain markets in Turkey. The investigation is focused on determining whether these sweet bars, often considered as a healthy alternative, align with both health and environmental considerations, particularly in relation to the food miles concept. By scrutinizing the ingredients of these sweet bars, the research aims to shed light on their overall impact on health and the environment, contributing valuable insights to the discourse on sustainable and health-conscious consumer choices in the Turkish market.
Materials and methods
The identification of supermarkets
The research commenced with the selection of major supermarket chains accessible across Turkey, Istanbul, Turkey, which have a broad consumer network reachable nationwide. The websites of these supermarkets were scrutinized, and those exclusively selling products in specific regions or major cities were eliminated. Consequently, it was decided to collaborate with 12 supermarkets.
Selection of bars
Appropriate products for the bar category were distinguished among the items merchandised under the healthy products section in chain supermarkets. A descriptive study was designed, focusing on examining the label information of brands marketed as 'healthy bars'. Products catering to specific requirements groups such as children were excluded, and only those specifically targeted at adults and organized as healthy, with no particular health claims, were included. As a result, a total of 49 different 'healthy bars' from 12 companies were identified. Four of those companies made the major contribution to the data, providing a combined total of 27 healthy snack bars.
Data collection of contents
During the data collection period from 10 to 25 July, 2023, researchers visited the selected supermarkets, identified the products on the shelves, and collected the content information mentioned on the labels. Considering situations such as the temporary unavailability of products on the shelves, three different locations of the same supermarket chain were visited to ensure the presence of the identical products on all shelves. Subsequently, the label information of all products was compared with the brands' websites, and if the label information was detected to be insufficient, the required data were collected from the respective product websites. To enhance the study's diversity, additional information about bar options available on brand websites but not found in supermarkets was also collected. Inclusion criteria mandated that each bar need to be produced in Turkey. Nutritional content, encompassing energy (Kcal), total fat (g), saturated fat (g), sugar (g), carbohydrates (g), protein (g), and fiber content (g), was extracted from the package and web pages. If not explicitly provided, the quantities for 100 g of the product were calculated. Bars containing trans fats, added sugars, glucose, and/or fructose syrup were excluded from the study.
Statistical method
The current study adopts a descriptive research design to investigate the characteristics of dried fruits and derivatives. IBM SPSS 22.0 for Windows program was applied for statistical analysis. Descriptive statistics were provided as follows: categorical variables were presented as counts and percentages, while numerical variables included mean, Standard Deviation (SD), minimum, maximum, and median Group distributions were compared using the Chi-square test. Since the comparisons of numerical variables failed to meet the assumption of normal distribution, independent comparisons of more than two groups were conducted using the Kruskal-Wallis test, and independent comparisons of two groups were performed using the Mann-Whitney U test. The alpha significance level was accepted as p<0.05. Additionally, it is noted that in the study, the names of the snack bar products and their respective companies have not been disclosed for ethical reasons, ensuring confidentiality and anonymity.
Results
In this study, a comprehensive analysis of healthy bars was conducted, encompassing a total of 49 different products sourced from representative supermarket chains across Istanbul, Turkey. The evaluation involved analyzing various nutritional components, including energy, protein, fat, saturated fat, carbohydrates, salt, fiber, and sugar content, for each product. Notably, the examined bars predominantly featured dried fruit-based ingredients and were marketed with sweet flavors, promoting them as healthy options. The analysis aimed to provide a detailed comprehension of the nutritional profile of healthy bars available in the market, facilitating informed consumer choices and contributing to discussions on dietary recommendations and health promotion strategies. Detailed data regarding the average weights of products per package and the nutritional composition of the examined bars are outlined in Table 1. Moreover, the table provides information on the content per 100 g of the products (Table 1).
Table 1: Nutritional composition of bars (n=49)
| Mean±SD | Min | Max | |
| Weight | 36.3±5.8 | 20.0 | 40.0 |
| Calories (Kcal) | 134.0±33.5 | 64.0 | 189.8 |
| Protein | 3.4±2.0 | 0.5 | 8.3 |
| Saturated Fat | 1.5±1.4 | 0.0 | 7.6 |
| Oil | 4.5±3.6 | 0.0 | 13 |
| Carbohydrate | 19.2±3.1 | 12.7 | 25.7 |
| Salt | 0.1±0.2 | 0.0 | 1.0 |
| Fibre | 4.9±3.1 | 0.6 | 19 |
| Sugar | 14.1±8.0 | 4.6 | 49.2 |
| Mean±SD | Min | Max | |
| Energy (Kcal/100 g) | 368.7±66.9 | 222.5 | 521.0 |
| Protein (g/100 g) | 9.6±5.3 | 2.0 | 23.1 |
| Fat (g/100 g) | 11.7±9.6 | 0.0 | 33.0 |
| Saturated fat (g/100 g) | 3.9±3.7 | 0.0 | 19.0 |
| Carbohydrate (g/100 g) | 54.0±12.2 | 37.3 | 90.0 |
| Fiber (g/100 g) | 11.7±5.6 | 2.5 | 30.5 |
| Sugar(g/100 g) | 34.6±9.7 | 13.0 | 64.0 |
| Salt (g/100 g) | 0.3±0.5 | 0.0 | 2.5 |
Upon assessing various types of bars with different contents, products derived from dried fruits, particularly date fruits and those obtained from date fruits (e.g., date juice, date extract), are the most prominently featured, constituting the highest proportion at 87%. Following date fruits, the sequence of prevalence is apple (34.7%), cherry (14.3%), orange (10.2%), and other dried fruits, respectively (Figure 1).
Figure 1: Dry fruit contents of bars (%)
The production scheme includes not just the dried fruits but also their juices, dried forms, and peels. The various uses and quantities of dried fruits in the examined bars are detailed in Table 2.
In the production of bars, a variety of ingredients such as nuts, cocoa, coconut, spices, sweeteners, and other flavor enhancers have been utilized. Among these, oily seeds stand out as the most preferred ingredient, comprising 75.5%. Subsequently, cocoa, spices, or sweeteners (57.1%), other flavor enhancers (22.4%), and coconut (18.4%) oily seeds follow in preference, as illustrated in Figure 2.
In the production of bars, a variety of ingredients such as nuts, cocoa, coconut, spices, sweeteners, and other flavor enhancers have been utilized. Among these, oily seeds stand out as the most preferred ingredient, comprising 75.5%. Subsequently, cocoa, spices, or sweeteners (57.1%), other flavor enhancers (22.4%), and coconut (18.4%) oily seeds follow in preference, as illustrated in Figure 2.
Table 2: Contents of dried fruits and products derivatived in snack bars
| Included | Not ıncluded | |
| n (%) | n (%) | |
| Date and products prepared of it | 43 (87.8%) | 6 (12.2%) |
| Date palm | 41 (83.7%) | 8 (16.3%) |
| Date juice | 1 (2.0%) | 48 (98.0%) |
| Date extract | 2 (4.1%) | 47 (95.9%) |
| Apple and products prepared of it | 17 (34.7%) | 32 (65.3%) |
| Apple | 8 (16.3%) | 41 (83.7%) |
| Dried apples | 2 (4.1%) | 47 (95.9%) |
| Apple juice | 7 (14.3%) | 42 (85.7%) |
| Cherry and products prepared of it | 8 (14.3%) | 41 (85.7%) |
| Cherry | 7 (14.3%) | 42 (85.7%) |
| Cherry juice | 1 (2.0%) | 48 (98.0%) |
| Orange and products prepared of it | 6 (10.2%) | 43 (89.9%) |
| Orange | 1 (2.0%) | 48 (98.0%) |
| Orange peel | 1 (2.0%)2 | 48 (98.0%) |
| Orange juice | 1 (2.0%) | 48 (98.0%) |
| Orange powder | 1 (2.0%) | 48 (98.0%) |
| Orange extract | 1 (2.0%) | 48 (98.0%) |
| Dried oranges | 1 (2.0%) | 48 (98.0%) |
| Strawberry and products prepared of it | 5 (8.2%) | 44 (91.8%) |
| Strawberry | 1 (2.0%) | 48 (98.0%) |
| Strawberry juice | 1 (2.0%) | 48 (98.0%) |
| Dried strawberries | 1 (2.0%) | 48 (98.0%) |
| Strawberry powder | 1 (2.0%) | 48 (98.0%) |
| Strawberry Extract | 1 (2.0%) | 47 (98.0%) |
| Plum | 1 (2.0%) | 48 (98.0%) |
| Pumpkin | 1 (2.0%) | 48 (98.0%) |
| Blackberry | 2 (4.1%) | 47 (95.9%) |
| Gojiberry | 1 (2.0%) | 48 (98.0%) |
| Blueberry | 2 (4.1%) | 47 (95.9%) |
| Cranberry | 4 (8.2%) | 45 (91.8%) |
| Dried bananas | 1 (2.0%) | 48 (98.0%) |
| Dried mulberry | 1 (2.0%) | 48 (98.0%) |
| Lemon puree | 5 (10.2%) | 44 (89.8%) |
Figure 2: Quantity of nuts, cocoa, coconut, spices and sweeteners, and other flavor enhancers (%)
Almonds have been recognized as the most preferred variety among all types of nuts. Detailed information regarding the contents of other ingredients excluding nuts and their inclusion in the production scheme is provided in Table 3.
Information regarding different ingredients used in addition to dried fruits, nuts, cocoa, coconut, spices, and sweeteners, which are frequently preferred in bars, is presented in Table 4. Among these ingredients, chickpea flour and chicory root fiber are some of the most preferred. All brands’ energy and nutritional contents are presented in Table 5.
Information regarding different ingredients used in addition to dried fruits, nuts, cocoa, coconut, spices, and sweeteners, which are frequently preferred in bars, is presented in Table 4. Among these ingredients, chickpea flour and chicory root fiber are some of the most preferred. All brands’ energy and nutritional contents are presented in Table 5.
Table 3: Contents of oil seeds, cocoa, coconut, spices, and sweeteners
| Included | Not included | |
| n (%) | n (%) | |
| Nuts and oil seeds | 37 (75.5%) | 12 (24.5%) |
| Almond | 18 (36.7%) | 31 (63.3%) |
| Hazelnut | 14 (28.6%) | 25 (71.4%) |
| Peanut | 7 (14.3%) | 42 (85.7%) |
| Pumpkin seeds | 4 (8.2%) | 45 (91.8%) |
| Cashew | 3 (6.1%) | 46 (93.9%) |
| Pistachio | 3 (6.1%) | 46 (93.9%) |
| Sunflower seeds | 2 (4.1%) | 47 (95.9%) |
| Hazelnut butter | 1 (2.0%) | 48 (98.0%) |
| Walnut | 1 (2.0%) | 48 (98.0%) |
| Brazil nut | 1 (2.0%) | 48 (98.0%) |
| Cocoa and deravative | 28 (57.1%) | 21 (42.9%) |
| Cocoa powder | 28 (57.1%) | 21 (42.9%) |
| Cocoa butter | 23 (46.9%) | 26 (53.1%) |
| Cocoa fiber | 2 (4.1%) | 47 (95.9%) |
| Cocoa mass | 1 (2.0%) | 48 (98.0%) |
| Coconut and deravative | 9 (18.4%) | 40 (81.6%) |
| Coconut kernel | 4 (8.2%) | 45 (91.8%) |
| Coconut oil | 3 (6.1%) | 46 (93.9%) |
| Coconut flour | 3 (6.1%) | 46 (93.9%) |
| Shredded coconut | 1 (2.0%) | 48 (98.0%) |
| Spices or flavorings | 28 (57.1%) | 21 (42.9%) |
| Cinnamon | 10 (20.4%) | 39 (79.6%) |
| Salt | 4 (8.2%) | 45 (91.8%) |
| Sea salt | 4 (8.2%) | 45 (91.8%) |
| Himalayan salt | 4 (8.2%) | 45 (91.8%) |
| Ginger | 3 (6.1%) | 46 (93.9%) |
| Vanilla | 2 (4.1%) | 47 (95.9%) |
| Other flavorings | 11 (22.4%) | 38 (69.0%) |
Table 4: Other ingredients used in bars (%)
| Included | Not ıncluded | |
| n (%) | n (%) | |
| Other content | 41 (83.7%) | 8 (16.3%) |
| Chickpea flour | 27 (55.1%) | 22 (44.9%) |
| Chicory root fiber | 18 (36.7%) | 31 (63.3%) |
| Pea protein | 7 (14.3%) | 42 (85.7%) |
| Sunflower lecithin | 6 (12.2%) | 43 (87.8%) |
| Chia seeds | 6 (12.2%) | 43 (87.8%) |
| Maltitol | 6 (12.2%) | 43 (87.8%) |
| Oatmeal | 6 (12.2%) | 43 (87.8%) |
| Barley malt | 4 (8.2%) | 45 (91.8%) |
| Vitamin C | 3 (6.1%) | 46 (93.9%) |
| Zinc | 3 (6.1%) | 46 (93.9%) |
| Hemp seed paste | 3 (6.1%) | 46 (93.9%) |
| Probiotic culture | 3 (6.1%) | 46 (93.9%) |
| Propolis | 3 (6.1%) | 46 (93.9%) |
| Whole wheat flakes | 3 (6.1%) | 46 (93.9%) |
| Butter | 3 (6.1%) | 46 (93.9%) |
| Olive oil | 3 (6.1%) | 46 (93.9%) |
| Carob flour | 2 (4.1%) | 47 (95.9%) |
| Flaxseed | 2 (4.1%) | 47 (95.9%) |
| Ground coffee | 2 (4.1%) | 47 (95.9%) |
| Green tea extract | 2 (4.1%) | 47 (95.9%) |
| Oat | 2 (4.1%) | 47 (95.9%) |
| Guarana extract | 1 (2.0%) | 48 (98.0%) |
| Hashish | 1 (2.0%) | 48 (98.0%) |
| Coffee | 1 (2.0%) | 48 (98.0%) |
| Carob powder | 1 (2.0%) | 48 (98.0%) |
| Rice flour | 1 (2.0%) | 48 (98.0%) |
| Pollen | 1 (2.0%) | 48 (98.0%) |
| Yellow chickpeas | 1 (2.0%) | 48 (98.0%) |
| Cellulose fiber (pectin) | 1 (2.0%) | 48 (98.0%) |
| Tahini | 1 (2.0%) | 48 (98.0%) |
Table 5: Nutritional value comparison of snack bars’ brands
| Brand | Weight | Energy (Kcal/100 g) |
Protein (g/100 g) |
Fat (g/100 g) |
Saturated Fat (g/100 g) |
Carbohydrate (g/100 g) |
Fiber (g/100 g) |
Sugar (g/100 g) |
Salt(g/100 g) | |
| Brand A | N Mean±SD |
6 40.00±0 |
6 417.50±27.90 |
6 10.00±5.30 |
6 22.10±6.30 |
6 8.10±1.80 |
6 56.40±8.60 |
6 6.50±2.80 |
6 27.40±5.00 |
6 0.10±0.10 |
| Min | 40.00 | 403.00 | 6.80 | 17.60 | 6.80 | 44.20 | 4.20 | 18.40 | 0.025 | |
| Max | 40.00 | 474.00 | 20.60 | 32.70 | 11.35 | 64.40 | 12.00 | 31.60 | 0.30 | |
| Median | 40.00 | 406.00 | 7.90 | 18.50 | 7.40 | 60.55 | 5.60 | 29.05 | 0.025 | |
| Brand B | N | 7 | 7 | 7 | 7 | 7 | 7 | 7 | 7 | 7 |
| Mean±SD | 37.90±2.70 | 352.60±25.60 | 9.50±2.10 | 7.10±4.80 | 2.10±1.40 | 55.90±7.30 | 13.60±2.50 | 41.10±4.70 | 0.40±0.90 | |
| Min | 35.00 | 309.00 | 6.80 | 1.60 | 0.60 | 48.10 | 11.10 | 33.60 | 0.00 | |
| Max | 40.00 | 384.00 | 12.20 | 13.00 | 3.90 | 69.30 | 17.50 | 47.10 | 2.50 | |
| Median | 40.00 | 349.00 | 8.60 | 6.40 | 1.30 | 56.30 | 13.10 | 42.20 | 0.00 | |
| Brand C | N | 5 | 5 | 5 | 5 | 5 | 5 | 5 | 5 | 5 |
| Mean±SD | 21.00±2.20 | 338.20±14.40 | 2.40±0.20 | 0.00±0.00 | 0.00±0.00 | 83.80±4.10 | 5.00±4.40 | 47.90±11.70 | 0.10±0.00 | |
| Min | 20.00 | 320.00 | 2.00 | 0.00 | 0.00 | 80.00 | 2.50 | 36.00 | 0.05 | |
| Max | 25.00 | 355.00 | 2.50 | 0.00 | 0.00 | 90.00 | 12.80 | 64.00 | 0.08 | |
| Median | 20.00 | 336.00 | 2.50 | 0.00 | 0.00 | 84.00 | 3.00 | 46.50 | 0.05 | |
| Brand D | N | 9 | 9 | 9 | 9 | 9 | 9 | 9 | 9 | 9 |
| Mean±SD | 39.40±1.70 | 312.90±14.60 | 6.70±1.30 | 3.30±1.00 | 3.30±1.00 | 49.70±4.20 | 13.20±1.10 | 36.90±3.80 | 0.00±010 | |
| Min | 35.00 | 290.00 | 5.25 | 2.00 | 2.00 | 45.50 | 11.25 | 31.50 | 0.00 | |
| Max | 40.00 | 332.50 | 8.75 | 5.75 | 5.75 | 58.00 | 15.40 | 43.70 | 0.25 | |
| Median | 40.00 | 312.50 | 6.50 | 3.25 | 3.25 | 48.25 | 13.00 | 37.50 | 0.00 | |
| Brand E* | N | 3 | 3 | 3 | 3 | 3 | 3 | 3 | 3 | 3 |
| Mean±SD | 35.00±0.00 | 495.00±22.70 | 11.30±1.60 | 28.30±4.00 | 8.10±3.40 | 44.00±4.60 | 8.70±2.30 | 15.00±2.60 | 0.40±0.00 | |
| Min | 35.00 | 479.00 | 9.90 | 26.00 | 6.00 | 39.00 | 6.50 | 13.00 | 0.43 | |
| Max | 35.00 | 521.00 | 13.00 | 33.00 | 12.00 | 48.00 | 11.00 | 18.00 | 0.46 | |
| Median | 35.00 | 485.00 | 11.00 | 26.00 | 6.40 | 45.00 | 8.70 | 14.00 | 0.43 | |
| Brand F* | N | 3 | 3 | 3 | 3 | 3 | 3 | 3 | 3 | 3 |
| Mean±SD | 35.00±0.00 | 387.00±19.50 | 8.00±0.50 | 15.50±3.50 | 2.30±1.00 | 47.60±3.10 | 13.20±0.90 | 42.50±6.90 | 0.10±0.00 | |
| Minimum | 35.00 | 365.00 | 7.70 | 11.70 | 1.10 | 44.60 | 12.30 | 38.00 | 0.11 | |
| Maximum | 35.00 | 402.00 | 8.60 | 18.60 | 2.90 | 50.80 | 14.00 | 50.50 | 0.14 | |
| Median | 35.00 | 394.00 | 7.70 | 16.20 | 2.80 | 47.40 | 13.40 | 39.10 | 0.11 | |
| Brand G* | N | 3 | 3 | 3 | 3 | 3 | 3 | 3 | 3 | 3 |
| Mean±SD | 40.00±0.00 | 248.30±23.20 | 20.00±0.00 | 5.10±0.10 | 2.70±1.90 | 52.00±2.90 | 22.60±6.90 | 26.10±3.90 | 1.00±0.30 | |
| Min | 40.00 | 222.50 | 20.00 | 5.00 | 0.50 | 49.00 | 17.50 | 23.25 | 0.75 | |
| Max | 40.00 | 267.50 | 20.00 | 5.25 | 3.75 | 54.75 | 30.50 | 30.50 | 1.25 | |
| Median | 40.00 | 255.00 | 20.00 | 5.00 | 3.75 | 52.25 | 19.75 | 24.50 | 1.00 | |
| Brand H* | N | 4 | 4 | 4 | 4 | 4 | 4 | 4 | 4 | 4 |
| Mean±SD | 34.00±0.00 | 314.30±36.30 | 19.90±3.70 | 7.60±4.80 | 0.90±0.60 | 41.50±4.00 | 9.60±0.80 | 29.50±1.80 | 0.60±0.30 | |
| Min | 34.00 | 277.00 | 14.50 | 3.60 | 0.40 | 37.30 | 8.70 | 28.10 | 0.20 | |
| Max | 34.00 | 364.00 | 23.10 | 14.60 | 1.70 | 46.70 | 10.60 | 32.10 | 0.80 | |
| Median | 34.00 | 308.00 | 21.00 | 6.15 | 0.70 | 41.05 | 9.55 | 28.90 | 0.70 | |
| Brand I* | N | 4 | 4 | 4 | 4 | 4 | 4 | 4 | 4 | 4 |
| Mean±SD | 40.00±0.00 | 435.00±14.60 | 8.00±1.40 | 18.30±3.40 | 2.70±2.90 | 55.00±2.40 | 10.50±3.10 | 34.60±5.20 | 0.30±0.20 | |
| Min | 40.00 | 420.00 | 7.00 | 14.00 | 0.75 | 53.00 | 8.00 | 27.50 | 0.10 | |
| Max | 40.00 | 447.50 | 10.00 | 21.00 | 7.00 | 58.00 | 15.00 | 40.00 | 0.50 | |
| Median | 40.00 | 436.25 | 7.50 | 19.00 | 1.50 | 54.50 | 9.50 | 35.50 | 0.20 | |
| Brand J* | N | 1 | 1 | 1 | 1 | 1 | 1 | 1 | 1 | 1 |
| Mean | 40.00 | 458.00 | 9.30 | 24.30 | 5.00 | 46.50 | 19.50 | 40.00 | 0.30 | |
| Min | 40.00 | 458.00 | 9.25 | 24.25 | 5.00 | 46.50 | 19.50 | 40.00 | 0.25 | |
| Max | 40.00 | 458.00 | 9.25 | 24.25 | 5.00 | 46.50 | 19.50 | 40.00 | 0.25 | |
| Median | 40.00 | 458.00 | 9.25 | 24.25 | 5.00 | 46.50 | 19.50 | 40.00 | 0.25 | |
| Brand K* | N | 2 | 2 | 2 | 2 | 2 | 2 | 2 | 2 | 2 |
| Mean±SD | 40.00±0.00 | 421.50±4.90 | 6.70±1.70 | 19.50±0.70 | 11.50±10.60 | 50.30±0.40 | 22.40±6.50 | 34.90±4.80 | 1.60±0.20 | |
| Min | 40.00 | 418.00 | 5.50 | 19.00 | 4.00 | 50.00 | 17.75 | 31.50 | 1.50 | |
| Max | 40.00 | 425.00 | 7.90 | 20.00 | 19.00 | 50.50 | 27.00 | 38.25 | 1.75 | |
| Median | 40.00 | 421.50 | 6.70 | 19.50 | 11.50 | 50.25 | 22.38 | 34.88 | 1.63 | |
| Brand L* | N | 2 | 2 | 2 | 2 | 2 | 2 | 2 | 2 | 2 |
| Mean±SD | 35.00±0.00 | 449.00±0.00 | 9.90±0.00 | 24.50±0.00 | 7.30±0.00 | 42.20±0.00 | 9.40±0.00 | 26.40±0.00 | 0.10±0.00 | |
| Min | 35.00 | 449.00 | 9.90 | 24.50 | 7.30 | 42.20 | 9.40 | 26.40 | 0.09 | |
| Max | 35.00 | 449.00 | 9.90 | 24.50 | 7.30 | 42.20 | 9.40 | 26.40 | 0.09 | |
| Median | 35.00 | 449.00 | 9.90 | 24.50 | 7.30 | 42.20 | 9.40 | 26.40 | 0.09 | |
| p-value | <0.001 | 0.001 | <0.001 | <0.001 | 0.003 | 0.002 | 0.001 | 0.014 | ||
* Insufficient sample size was not included in the analysis Kruskal-Wallis Test
Discussion
This research evaluated the energy and nutrient ratios of fruit-based snack bars. Examining their contents, it has been discovered that ingredients including dried fruits, nuts, and cocoa, are consistent with global snack bar production. Compared to other sweet bars, the bars in this study manifested identical protein ratios but had higher fiber and lower fat, saturated fat, and sugar ratios (Damen et al., 2022).
Snack bars are available in various categories, including protein bars, cereal bars, and those suitable for weight loss (Kosicka-Gębska et al., 2022). A study on healthy food preferences detected that health-conscious individuals are interested in snacks with added fruits (Bandy et al., 2021). This inclination is primarily driven by the desire to consume nutritious products and prioritize health (Kosicka- Gębska et al., 2022). In the recent years, the identical trend has been recognized in Turkish market as well (Saygı et al., 2022).
Healthy snack bars are versatile, and appealing to various age groups and individuals with different health conditions. They can serve as beneficial snack choices in obesity treatment (Binou et al., 2022). In addition, their convenience as a Ready-to-Eat (RTE) energy source makes them readily accessible for the elderly. These bars can be a valuable option for preventing undesired weight and muscle depletion in older individuals (Gaddey and Holder, 2014). For seniors and individuals with chewing difficulties caused by age-related factors (Ju et al., 2021) or certain medical conditions (Matuleviciene et al., 2023), the smoother texture of healthy snack bars can facilitate easier energy intake.
The preference of children for healthy snacks has been anprominent topic in literature (Ragelienė, 2021). It is noted that children prefer consuming food groups such as vegetables, which they typically do not favor in their natural state, in the form of healthy snack bars (Jønsson et al., 2019). Snack bars often exhibit elevated sugar content; nonetheless, this sugar content stems exclusively from naturally occurring sugars in fruits, accompanied by remarkably high fiber content. The fiber content of the snack bars that has been analyzed in this study was 11.7 g/100 g. The comparison between brandsindicated that the bars containnig higher amount of almond and hazelnut had higher fiber levels as well. This result is in agreement with previous studies that observed the fiber content of nut-containing products (Kowalski et al., 2022).
In the analysis of the fruit bars in this study, it was found that dates were the most frequently chosen type of dried fruit. Identical results detected by previously held studies. The main reason for the preference of dates in the production of snack bar is that beyond contributing to the texture of these bars, dates are favored for their positive impact on health. With a sweet taste and high carbohydrate content, dates also provide rich sources of dietary fiber, including beta-glucans, and unsaturated fatty acids. The decision to include dates in the production of healthy snacks is influenced by their unique amino acid composition, with lysine and histidine, which are less common in other fruits. Furthermore, dates are notable for their content of phenolic acids, carotenoids, and polyphenols (Hussain et al., 2020). Research has demonstrated the antioxidant potential of bioactivecompounds in dates, ranging from 55 to 75% capacity (Fernández-López et al., 2022). Recognized for their health benefits, dates are consistently preferred in the preparation of healthy snack bars, a trend observed not only in Turkey but also in various other countries (Barakat and Alfheeaid, 2023).
Another prominently featured food group with high content in the preferred products is identified as nuts such as hazelnuts, walnuts, peanuts, and cashews. Hazelnuts, walnuts, peanuts, and cashews, which contain unsaturated fatty acids in their composition, are important additions to the diet not only due to these healthy fats but also for their contribution of protein, certain minerals, and vitamins (Eslami et al., 2022). The consumption of foods composing of healthy fats such as nuts and seeds is recommended in the Mediterranean diet, which is known to be protective effects against many chronic diseases (Pérez-Vega et al., 2023). In addition, nuts are considered an appealing element in enriching the texture of healthy snack bars, catering to taste preferences.
There is agrowing preference for snack options that not only offer health benefits but also cater to taste preferences. In this context, sweet and healthy bars, perceived as healthier alternatives, are gaining popularity over options including chocolate bars (Michel et al., 2021). For these healthy snack bars to be appealing, they require to be both nutritionally rich and flavorful. Bars containing chocolate are particularly favored to enhance flavor. However, opting for fruit alternatives to achieve sweetness fails always correspond to acceptable flavor levels (Salazar et al., 2019). Therefore, cocoa and its derivatives are commonly utilized in the production of healthy snack bars to replicate chocolate-like flavors (Shahanas et al., 2019).
Over the past decade, the global snack bar market has experienced significant growth, with the market expected to reach 19 billion United States Dollar (USD) by 2025, up from 15 billion USD in 2019 (Ayad et al., 2020). These figures highlight the economic importance of healthy snack bars. However, processes such as increased production and transportation of ingredients in the snack bar industry raise questions about sustainability, considering the energy expended in these processes. Especially in recent years, it has been observed that individuals are increasingly concerned about climate change and realize that these changes will affect their lives more closely in the near future (Van Valkengoed et al., 2023).
The term "carbon footprint" denotes a specific amount of gas produced as a result of human production and consumption activities, including CO2 and other gases. The carbon footprint is associated with global warming (Holka et al., 2022), and approximately one-fourth of the world's emitted greenhouse gases are attributed to food production (Ritchie et al., 2020). Over 80% of the carbon footprint in most foods related to Land use and emissions during farming (IPCC, 2018).
Rgarding that food transportation contributes less to emissions compared to land use, transitioning to plant-based foods and consuming locally produced items are recommended to decrease the environmental impact of food (Li et al., 2022). However, this poses challenges for snack bars, as ingredients with diverse origins may influence both positive and negative aspects of sustainability. For instance, the use of dates, a commonly employed ingredient in healthy snack bars, requires warm climate conditions for quality and taste.Whereas achieving these conditions in greenhouse environments is possible, it is known to be more emission-intensive and costlier. As a result, naturally grown dates from the Arabian Peninsula are often transported to be usedin production. The bars examined in this this research included dates that from the Arabian Peninsula.
Studies comparing the carbon footprint of identical products transported over identicaldistances highlight the impact of transportation choices. For instance, the total carbon footprint of green beans produced in Kenya is reported to be 12-13 times higher than that of beans produced in the United Kingdom. Opting for air transport intensifies this difference to 20-26 times (Galford et al., 2020). This emphasizes the importance of regarding the contribution of transportation processes to the carbon footprint and encourages the use of locally or regionally sourced ingredients.
As a major global producer in the cultivation of hazelnuts and almonds, Turkye plays a significant role. In 2020, Turkye's hazelnut production reached 665,000 tons, securing the top position in global hazelnut exports with 157 tons/year.In particular, the conversion of products including hazelnuts into items such as hazelnut-containing bars aligns with the philosophy of food miles, reducing greenhouse gas emissions and energy consumption (Bozoğlu et al., 2019). Accordingly, Türkiye's almond production in 2020 reached 159 thousand tons, accounting for approximately 4% of global almond production. The use of almonds for the production of local products benefits from shorter transport distances compared to imports, promotes regional agricultural diversity and supports the local economy (Yılmaz and Bayav, 2023). While hazelnut and almond production in Turkye exemplifies the potential to reduce food miles, the effects of this practice depend on various factors such as cultivation regions, processing proximity, as well as transportation efficiency. Ultimately, these efforts contribute to the environmental and economic sustainability of the country's agricultural sector. Coconut is native to various tropical regions worldwide, but the global popularity of by-productssuch as coconut oil and coconut water necessitates international transportation. From an environmental perspective, this transportation is associated with substantial greenhouse gas emissions and energy consumption. This situation is consistent with research findings highlighting the environmental impacts of long-distance food transport (Suja et al., 2022).
The product with the highest proportion among the contents of the healthy snack bars included in the study was dates. In the context of assessing food miles and environmental impacts, the transportation of dates from Saudi Arabia to Turkye, covering approximately 2,000 km, typically involves both road and sea transportation and generates moderate emissions. In contrast, the transportation of dried figs from Greece to the United States, which covers a much longer distance of about 8,000 km, results in higher emissions due to the significantly longer route, particularly when carried out by sea transportation, emphasizing the considerable environmental impact of importing products from distant locations. Sea transportation is preferred for the transpoting dates due to cost-effectiveness for long-distance exports (Dai et al., 2020). Both dates and dried figs require appropriate packaging and protection to maintain quality, and packaging choices can affect transportation efficiency and emissions (ICARDA, 2019). As examining healthy snack bars produced in Turkye, where dates and nuts are prominently featured, both in terms of production and transportation, they appear to have sustainable effects. The utilization of products obtained from sustainable sources in the production and transportation of foods is crucial in assessing environmental impacts. Having a sustainable production scheme highlights the complex balance required to meet consumer demands while adopting environmentally responsible practices.
Conclusion
In conclusion, our analysis of healthy snack bars produced in Turkye emphasizes the significance of considering both production and transportation practices for the development of sustainable food systems. The inclusion of locally sourced ingredients, such as hazelnuts and almonds, reflects efforts to reduce food miles and minimize environmental impacts. Transportation practices, exemplified by cases of date transportation from Saudi Arabia to Turkye and dried fig transportation from Greece to the United States, highlight the necessity of optimizing supply chains to achieve environmental sustainability. The careful selection of packaging materials and practices is crucial in maintaining product quality while minimizing transportation-related environmental effects.
Future research should adopt a more comprehensive approach by expanding the scope beyond particular product categories, conducting in-depth supply chain analyses, and exploring consumer dynamics to provide a nuanced comprehension of sustainable food production and transportation practices. Moreover, the practical application of our findings for consumers and local authorities lies in promoting informed decision-making and policy development to encourage sustainable food choices and practices, ultimately contributing to the creation of more resilient and environmentally conscious food systems.
Author contributions
İ.Ö.A., E.Ö.E., and S.Y. designed the study; S.Y. collected the data; İ.Ö.A. and E.Ö.E. analyzed the data, İ.Ö.A. and E.Ö.E. wrote the manuscript. All authors read and approved the final manuscript.
Acknowledgement
This study does not require ethical permission as it primarily involves the analysis of commercially available healthy snack bars in Istanbul, focusing on their nutritional content and environmental considerations. It falls within the scope of observational and content analysis research that does not necessitate ethical approval.
Conflict of Interest
The authors declare no conflicts of interest associated with the research, analysis, and findings presented in this study.
Funding
This research did not receive any specific grant from funding agencies in the public, commercial, or not-for-profit sectors.
Ethical consideration
No ethical approval is required.
References
Abdi-Moghadam Z., Darroudi M., Mahmoudzadeh M., Mohtashami M., Jamal A.M., Shamloo E., Rezaei Z. (2023). Functional yogurt, enriched and probiotic: a focus on human health. Clinical Nutrition ESPEN. 57: 575-586. [DOI: 10.1016/j.clnesp.2023.08.005]
Afrouzi H.N., Ahmed J., Siddique B.M., Khairuddin N., Hassan A. (2023). A comprehensive review on carbon footprint of regular diet and ways to improving lowered emissions. Results in Engineering. 18: 101054. [DOI: 10.1016/j.rineng.2023.101054]
Ayad A.A., Williams L.L., Gad El-Rab D.A., Ayivi R., Colleran H.L., Aljaloud S., Ibrahim S.A. (2020). A review of the chemical composition, nutritional and health benefits of dates for their potential use in energy nutrition bars for athletes. Cogent Food and Agriculture. 6: 1809309. [DOI: 10.1080/23311932.2020.1809309]
Bandy L.K., Scarborough P., Harrington R.A., Rayner M., Jebb S.A. (2021). The sugar content of foods in the UK by category and company: a repeated cross-sectional study, 2015-2018. PLoS Medicine. 18: e1003647. [DOI: 10.1371/journal.pmed.1003647]
Barakat H., Alfheeaid H.A. (2023). Date palm fruit (Phoenix dactylifera) and ıts promising potential in developing functional energy bars: review of chemical, nutritional, functional, and sensory attributes. Nutrients. 15: 2134. [DOI: 10.3390/nu15092134]
Binou P., Yanni A.E., Kartsioti K., Barmpagianni A., Konstantopoulos P., Karathanos V.T., Kokkinos A. (2022). Wheat biscuits enriched with plant-based protein contribute to weight loss and beneficial metabolic effects in subjects with overweight/obesity. Nutrients. 14: 2516. [DOI: 10.3390/nu14122516]
Bozoğlu M., Başer U., Kilic Topuz B., Alhas Eroğlu N. (2019). An overview of hazelnut markets and policy in Turkey. KSU Journal of Agriculture and Nature. 22: 733-743. [DOI: 10.18016/ ksutarimdoga.v22i45606.532645]
Cochran N., Walensky R.P., Moyer B.C., Madans J.H. (2021). Health, United States, 2019. National Center for Health Statistics, Hyattsville. [DOI: 10.15620/cdc:100685]
Dai T., Yang Y., Lee R., Fleischer A.S., Wemhoff A.P. (2020). Life cycle environmental impacts of food away from home and mitigation strategies—a review. Journal of Environmental Management. 265: 110471. [DOI: 10.1016/j.jenvman.2020.110471]
Damen F., Verkerk R., Steenbekkers B. (2022). Healthiness, naturalness and sustainability perception of adolescents toward chocolate snack bars. British Food Journal. 124: 200-218. [DOI: 10.1108/BFJ-09-2021-0964]
Eslami O., Khorramrouz F., Sohouli M., Bagheri N., Shidfar F., Fernandez M.L. (2022). Effect of nuts on components of metabolic syndrome in healthy adults with overweight/obesity: a systematic review and meta-analysis. Nutrition, Metabolism and Cardiovascular Diseases. 32: 2459-2469. [DOI: 10.1016/j.numecd.2022.07.015]
European Comission. (2023). Commission staff working document, drivers of food security. URL: https:// commission.europa.eu/system/files/2023-01/SWD_ 2023_4 _1_EN_document_travail_service_part1_v2.pdf. Accessed 22 November 2023.
Fernández-López J., Viuda-Martos M., Sayas-Barberá E., Navarro-Rodríguez De Vera C., Pérez-Álvarez J.Á. (2022). Biological, nutritive, functional and healthy potential of date palm fruit (Phoenix dactylifera L.): current research and future prospects. Agronomy. 12: 876. [DOI: 10.3390/agronomy12040876]
Gaddey H.L., Holder K. (2014). Unintentional weight loss in older adults. American Family Physician. 89: 718-722.
Galford G.L., Peña O., Sullivan A.K., Nash J., Gurwick N., Pirolli G., Richards M., White J., Wollenberg E. (2020). Agricultural development addresses food loss and waste while reducing greenhouse gas emissions. Science of the Total Environment. 699: 134318. [DOI: 10.1016/j.scitotenv.2019.134318]
Gargano D., Appanna R., Santonicola A., De Bartolomeis F., Stellato C., Cianferoni A., Iovino P. (2021). Food allergy and intolerance: a narrative review on nutritional concerns. Nutrients. 13: 1638. [DOI: 10.3390/nu13051638]
Glavič P. (2021). Evolution and current challenges of sustainable consumption and production. Sustainability. 13: 9379. [DOI: 10.3390/su13169379]
Holka M., Kowalska J., Jakubowska M. (2022). Reducing carbon footprint of agriculture—can organic farming help to mitigate climate change?. Agriculture. 12: 1383. [DOI: 10.3390/agriculture12091383]
Hussain M.I., Farooq M., Syed Q.A. (2020). Nutritional and biological characteristics of the date palm fruit (Phoenix dactylifera L.) – a review. Food Bioscience. 34: 100509. [DOI: 10.1016/j.fbio.2019.100509]
International Center for Agricultural Research in the Dry Areas (ICARDA). (2019). Development of sustainable date palm production systems in the GCC. URL: https://mel.cgiar.org/reporting/download/hash/10cb7d8d993c741dd3feb8239f2aba34 Accessed 10 June 2024.
Jønsson S.R., Angka S., Olsen K., Tolver A., Olsen A. (2019). Repeated exposure to vegetable-enriched snack bars may increase children's liking for the bars - but not for the vegetables. Appetite. 140: 1-9. [DOI: 10.1016/j.appet.2019. 05.002]
Ju Y.J., Lee J.E., Lee S.Y. (2021). Associations between chewing difficulty, subjective cognitive decline, and related functional difficulties among older people without dementia: focus on body mass ındex. The Journal of Nutrition, Health and Aging. 25: 347-355. [DOI: 10.1007/s12603-020-1521-2]
Kosicka-Gębska M., Jeżewska-Zychowicz M., Gębski J., Sajdakowska M., Niewiadomska K., Nicewicz R. (2022). Consumer motives for choosing fruit and cereal bars—differences due to consumer lifestyles, attitudes toward the product, and expectations. Nutrients. 14: 2710. [DOI: 10.3390/nu14132710]
Kowalski S., Oracz J., Skotnicka M., Mikulec A., Gumul D., Mickowska B., Mazurek A., Sabat R., Wywrocka-Gurgul A., Żyżelewicz D. (2022). Chemical composition, nutritional value, and acceptance of nut bars with the addition of edible ınsect powder. Molecules. 27: 8472. [DOI: 10.3390/ molecules27238472]
Li M., Jia N., Lenzen M., Malik A., Wei L., Jin Y., Raubenheimer D. (2022). Global food-miles account for nearly 20% of total food-systems emissions. Nature Food. 3: 445-453. [DOI: 10.1038/s43016-022-00531-w]
Matuleviciene A., Siauryte K., Kuiper E, Grabrucker A.M., European Phelan-McDermid syndrome guideline consortium. (2023). Consensus recommendations on chewing, swallowing and gastrointestinal problems in Phelan-McDermid syndrome. European Journal of Medical Genetics. 66: 104763. [DOI: 10.1016/j.ejmg.2023.104763]
Michel F., Sanchez-Siles L.M., Siegrist M. (2021). Predicting how consumers perceive the naturalness of snacks: the usefulness of a simple index. Food Quality and Preference. 94: 104295. [DOI: 10.1016/j.foodqual.2021.104295]
Pérez-Vega K.A., Castañer O., Sanllorente A., Lassale C., Ros E., Pintó X., Estruch R., Salas-Salvadó J., Corella D., Alonso-Gómez Á.M., Serra-Majem L., Razquin C., et al. (2023). Mediterranean diet, energy restriction, physical activity, and atherogenicity of very-low density lipoproteins: findings from two randomized controlled trials. Molecular Nutrition and Food Research. 67: 2200338. [DOI: 10.1002/mnfr. 202200338]
Ragelienė T. (2021). Do children favor snacks and dislike vegetables? exploring children's food preferences using drawing as a projective technique. A cross-cultural study. Appetite. 165: 105276. [DOI: 10.1016/j.appet.2021.105276]
Ritchie H., Rosado P., Roser M. (2020). Food production is responsible for one-quarter of the world’s greenhouse gas emissions, Our World in Data. URL: https://ourworldindata. org/food-ghg-emissions. Accessed 21 November 2023.
Salazar N.A., Fiszman S., Orrego C.E., Tarrega A. (2019). Evaluation of some ingredients and energy content on front-of-pack cereal bar labeling as drivers of choice and perception of healthiness: a case study with exercisers. Journal of Food Science. 84: 2269-2277. [DOI: 10.1111/1750-3841.14726]
Saygı Y.B., Mankan E., Ceylan Z., Çelik Ş., Uçkan Çakır M. (2022). Snack bars and consumption trends. Journal of Turkish Tourism Research . 6: 607-627. [DOI: 0.26677/TR1010.2022.1079]. [Turkish with English abstract]
Shahanas E., Panjikkaran S.T., Aneena E.R., Sharon C.L., Remya P.R. (2019). Health benefits of bioactive compounds from cocoa (Theobroma cacao). Agricultural Reviews. 40: 143-149. [DOI: 10.18805/ag.R-1851]
Sharafi H., Divsalar E., Rezaei Z., Liu S.-Q., Moradi M. (2023). The potential of postbiotics as a novel approach in food packaging and biopreservation: a systematic review of the latest developments. Critical Reviews in Food Science and Nutrition. 1-31. [DOI: 10.1080/10408398.2023.2253909]
Singh P., Ban Y.G., Kashyap L., Siraree A., Singh J. (2020). Sugar and sugar substitutes: recent developments and future prospects. In: Mohan N., Singh P. (Editors). Sugar and sugar derivatives: changing consumer preferences. Springer, Singapore.. pp: 39-75. [DOI: 10.1007/978-981-15-6663-9_4]
Suja G., Byju G., Jaganathan D. (2022). Coconut based cropping systems with climate resilient tuber crops for enhancing farm income: a success story from Kollam district of Kerala. Indian Coconut Journal. 65: 5-9.
The Intergovernmental Panel on Climate Change (IPCC). (2018). Global warming of 1.5 ºC. URL: https://www.ipcc.ch/site/ assets/uploads/sites/2/2019/06/SR15_Full_Report_High_Res.pdf. Accessed 01 November 2023.
Van Valkengoed A.M., Steg L., Perlaviciute G. (2023). The psychological distance of climate change is overestimated. One Earth. 6: 362-391. [DOI: 10.1016/j.oneear.2023.03.006]
Yılmaz A., Bayav A. (2023). Determination of energy efficiency in almond production according to variety: A case study in Turkey. Erwerbs-Obstbau. 65: 971-979. [DOI: 10.1007/ s10341-022-00728-0]
* Corresponding author (İ. Öztürk Altuncevahir)
* E-mail: ilaydahaj@gmail.com
ORCID ID: https://orcid.org/0000-0003-0652-9581
* E-mail: ilaydahaj@gmail.com
ORCID ID: https://orcid.org/0000-0003-0652-9581
Type of Study: Original article |
Subject:
Special
Received: 23/12/11 | Accepted: 24/06/20 | Published: 24/06/30
Received: 23/12/11 | Accepted: 24/06/20 | Published: 24/06/30
References
1. Abdi-Moghadam Z., Darroudi M., Mahmoudzadeh M., Mohtashami M., Jamal A.M., Shamloo E., Rezaei Z. (2023). Functional yogurt, enriched and probiotic: a focus on human health. Clinical Nutrition ESPEN. 57: 575-586. [DOI: 10.1016/j.clnesp.2023.08.005] [DOI:10.1016/j.clnesp.2023.08.005] [PMID]
2. Afrouzi H.N., Ahmed J., Siddique B.M., Khairuddin N., Hassan A. (2023). A comprehensive review on carbon footprint of regular diet and ways to improving lowered emissions. Results in Engineering. 18: 101054. [DOI: 10.1016/j.rineng.2023.101054] [DOI:10.1016/j.rineng.2023.101054]
3. Ayad A.A., Williams L.L., Gad El-Rab D.A., Ayivi R., Colleran H.L., Aljaloud S., Ibrahim S.A. (2020). A review of the chemical composition, nutritional and health benefits of dates for their potential use in energy nutrition bars for athletes. Cogent Food and Agriculture. 6: 1809309. [DOI: 10.1080/23311932.2020.1809309] [DOI:10.1080/23311932.2020.1809309]
4. Bandy L.K., Scarborough P., Harrington R.A., Rayner M., Jebb S.A. (2021). The sugar content of foods in the UK by category and company: a repeated cross-sectional study, 2015-2018. PLoS Medicine. 18: e1003647. [DOI: 10.1371/journal.pmed.1003647] [DOI:10.1371/journal.pmed.1003647] [PMID] [PMCID]
5. Barakat H., Alfheeaid H.A. (2023). Date palm fruit (Phoenix dactylifera) and ıts promising potential in developing functional energy bars: review of chemical, nutritional, functional, and sensory attributes. Nutrients. 15: 2134. [DOI: 10.3390/nu15092134] [DOI:10.3390/nu15092134] [PMID] [PMCID]
6. Binou P., Yanni A.E., Kartsioti K., Barmpagianni A., Konstantopoulos P., Karathanos V.T., Kokkinos A. (2022). Wheat biscuits enriched with plant-based protein contribute to weight loss and beneficial metabolic effects in subjects with overweight/obesity. Nutrients. 14: 2516. [DOI: 10.3390/nu14122516] [DOI:10.3390/nu14122516] [PMID] [PMCID]
7. Bozoğlu M., Başer U., Kilic Topuz B., Alhas Eroğlu N. (2019). An overview of hazelnut markets and policy in Turkey. KSU Journal of Agriculture and Nature. 22: 733-743. [DOI: 10.18016/ ksutarimdoga.v22i45606.532645] [DOI:10.18016/ksutarimdoga.v22i45606.532645]
8. Cochran N., Walensky R.P., Moyer B.C., Madans J.H. (2021). Health, United States, 2019. National Center for Health Statistics, Hyattsville. [DOI: 10.15620/cdc:100685] [DOI:10.15620/cdc:100685]
9. Dai T., Yang Y., Lee R., Fleischer A.S., Wemhoff A.P. (2020). Life cycle environmental impacts of food away from home and mitigation strategies-a review. Journal of Environmental Management. 265: 110471. [DOI: 10.1016/j.jenvman.2020.110471] [DOI:10.1016/j.jenvman.2020.110471] [PMID]
10. Damen F., Verkerk R., Steenbekkers B. (2022). Healthiness, naturalness and sustainability perception of adolescents toward chocolate snack bars. British Food Journal. 124: 200-218. [DOI: 10.1108/BFJ-09-2021-0964] [DOI:10.1108/BFJ-09-2021-0964]
11. Eslami O., Khorramrouz F., Sohouli M., Bagheri N., Shidfar F., Fernandez M.L. (2022). Effect of nuts on components of metabolic syndrome in healthy adults with overweight/obesity: a systematic review and meta-analysis. Nutrition, Metabolism and Cardiovascular Diseases. 32: 2459-2469. [DOI: 10.1016/j.numecd.2022.07.015] [DOI:10.1016/j.numecd.2022.07.015] [PMID]
12. European Comission. (2023). Commission staff working document, drivers of food security. URL: https:// commission.europa.eu/system/files/2023-01/SWD_ 2023_4 _1_EN_document_travail_service_part1_v2.pdf. Accessed 22 November 2023.
13. Fernández-López J., Viuda-Martos M., Sayas-Barberá E., Navarro-Rodríguez De Vera C., Pérez-Álvarez J.Á. (2022). Biological, nutritive, functional and healthy potential of date palm fruit (Phoenix dactylifera L.): current research and future prospects. Agronomy. 12: 876. [DOI: 10.3390/agronomy12040876] [DOI:10.3390/agronomy12040876]
14. Gaddey H.L., Holder K. (2014). Unintentional weight loss in older adults. American Family Physician. 89: 718-722.
15. Galford G.L., Peña O., Sullivan A.K., Nash J., Gurwick N., Pirolli G., Richards M., White J., Wollenberg E. (2020). Agricultural development addresses food loss and waste while reducing greenhouse gas emissions. Science of the Total Environment. 699: 134318. [DOI: 10.1016/j.scitotenv.2019.134318] [DOI:10.1016/j.scitotenv.2019.134318] [PMID]
16. Gargano D., Appanna R., Santonicola A., De Bartolomeis F., Stellato C., Cianferoni A., Iovino P. (2021). Food allergy and intolerance: a narrative review on nutritional concerns. Nutrients. 13: 1638. [DOI: 10.3390/nu13051638] [DOI:10.3390/nu13051638] [PMID] [PMCID]
17. Glavič P. (2021). Evolution and current challenges of sustainable consumption and production. Sustainability. 13: 9379. [DOI: 10.3390/su13169379] [DOI:10.3390/su13169379]
18. Holka M., Kowalska J., Jakubowska M. (2022). Reducing carbon footprint of agriculture-can organic farming help to mitigate climate change?. Agriculture. 12: 1383. [DOI: 10.3390/agriculture12091383] [DOI:10.3390/agriculture12091383]
19. Hussain M.I., Farooq M., Syed Q.A. (2020). Nutritional and biological characteristics of the date palm fruit (Phoenix dactylifera L.) - a review. Food Bioscience. 34: 100509. [DOI: 10.1016/j.fbio.2019.100509] [DOI:10.1016/j.fbio.2019.100509]
20. International Center for Agricultural Research in the Dry Areas (ICARDA). (2019). Development of sustainable date palm production systems in the GCC. URL: https://mel.cgiar.org/reporting/download/hash/10cb7d8d993c741dd3feb8239f2aba34 Accessed 10 June 2024.
21. Jønsson S.R., Angka S., Olsen K., Tolver A., Olsen A. (2019). Repeated exposure to vegetable-enriched snack bars may increase children's liking for the bars - but not for the vegetables. Appetite. 140: 1-9. [DOI: 10.1016/j.appet.2019. 05.002] [DOI:10.1016/j.appet.2019.05.002] [PMID]
22. Ju Y.J., Lee J.E., Lee S.Y. (2021). Associations between chewing difficulty, subjective cognitive decline, and related functional difficulties among older people without dementia: focus on body mass ındex. The Journal of Nutrition, Health and Aging. 25: 347-355. [DOI: 10.1007/s12603-020-1521-2] [DOI:10.1007/s12603-020-1521-2] [PMID]
23. Kosicka-Gębska M., Jeżewska-Zychowicz M., Gębski J., Sajdakowska M., Niewiadomska K., Nicewicz R. (2022). Consumer motives for choosing fruit and cereal bars-differences due to consumer lifestyles, attitudes toward the product, and expectations. Nutrients. 14: 2710. [DOI: 10.3390/nu14132710] [DOI:10.3390/nu14132710] [PMID] [PMCID]
24. Kowalski S., Oracz J., Skotnicka M., Mikulec A., Gumul D., Mickowska B., Mazurek A., Sabat R., Wywrocka-Gurgul A., Żyżelewicz D. (2022). Chemical composition, nutritional value, and acceptance of nut bars with the addition of edible ınsect powder. Molecules. 27: 8472. [DOI: 10.3390/ molecules27238472] [DOI:10.3390/molecules27238472]
25. Li M., Jia N., Lenzen M., Malik A., Wei L., Jin Y., Raubenheimer D. (2022). Global food-miles account for nearly 20% of total food-systems emissions. Nature Food. 3: 445-453. [DOI: 10.1038/s43016-022-00531-w] [DOI:10.1038/s43016-022-00531-w] [PMID]
26. Matuleviciene A., Siauryte K., Kuiper E, Grabrucker A.M., European Phelan-McDermid syndrome guideline consortium. (2023). Consensus recommendations on chewing, swallowing and gastrointestinal problems in Phelan-McDermid syndrome. European Journal of Medical Genetics. 66: 104763. [DOI: 10.1016/j.ejmg.2023.104763] [DOI:10.1016/j.ejmg.2023.104763] [PMID]
27. Michel F., Sanchez-Siles L.M., Siegrist M. (2021). Predicting how consumers perceive the naturalness of snacks: the usefulness of a simple index. Food Quality and Preference. 94: 104295. [DOI: 10.1016/j.foodqual.2021.104295] [DOI:10.1016/j.foodqual.2021.104295]
28. Pérez-Vega K.A., Castañer O., Sanllorente A., Lassale C., Ros E., Pintó X., Estruch R., Salas-Salvadó J., Corella D., Alonso-Gómez Á.M., Serra-Majem L., Razquin C., et al. (2023). Mediterranean diet, energy restriction, physical activity, and atherogenicity of very-low density lipoproteins: findings from two randomized controlled trials. Molecular Nutrition and Food Research. 67: 2200338. [DOI: 10.1002/mnfr. 202200338] [DOI:10.1002/mnfr.202200338] [PMID] [PMCID]
29. Ragelienė T. (2021). Do children favor snacks and dislike vegetables? exploring children's food preferences using drawing as a projective technique. A cross-cultural study. Appetite. 165: 105276. [DOI: 10.1016/j.appet.2021.105276] [DOI:10.1016/j.appet.2021.105276] [PMID]
30. Ritchie H., Rosado P., Roser M. (2020). Food production is responsible for one-quarter of the world's greenhouse gas emissions, Our World in Data. URL: https://ourworldindata. org/food-ghg-emissions. Accessed 21 November 2023.
31. Salazar N.A., Fiszman S., Orrego C.E., Tarrega A. (2019). Evaluation of some ingredients and energy content on front-of-pack cereal bar labeling as drivers of choice and perception of healthiness: a case study with exercisers. Journal of Food Science. 84: 2269-2277. [DOI: 10.1111/1750-3841.14726] [DOI:10.1111/1750-3841.14726] [PMID]
32. Saygı Y.B., Mankan E., Ceylan Z., Çelik Ş., Uçkan Çakır M. (2022). Snack bars and consumption trends. Journal of Turkish Tourism Research . 6: 607-627. [DOI: 0.26677/TR1010.2022.1079]. [Turkish with English abstract]
33. Shahanas E., Panjikkaran S.T., Aneena E.R., Sharon C.L., Remya P.R. (2019). Health benefits of bioactive compounds from cocoa (Theobroma cacao). Agricultural Reviews. 40: 143-149. [DOI: 10.18805/ag.R-1851] [DOI:10.18805/ag.R-1851]
34. Sharafi H., Divsalar E., Rezaei Z., Liu S.-Q., Moradi M. (2023). The potential of postbiotics as a novel approach in food packaging and biopreservation: a systematic review of the latest developments. Critical Reviews in Food Science and Nutrition. 1-31. [DOI: 10.1080/10408398.2023.2253909] [DOI:10.1080/10408398.2023.2253909] [PMID]
35. Singh P., Ban Y.G., Kashyap L., Siraree A., Singh J. (2020). Sugar and sugar substitutes: recent developments and future prospects. In: Mohan N., Singh P. (Editors). Sugar and sugar derivatives: changing consumer preferences. Springer, Singapore.. pp: 39-75. [DOI: 10.1007/978-981-15-6663-9_4] [DOI:10.1007/978-981-15-6663-9_4]
36. Suja G., Byju G., Jaganathan D. (2022). Coconut based cropping systems with climate resilient tuber crops for enhancing farm income: a success story from Kollam district of Kerala. Indian Coconut Journal. 65: 5-9.
37. The Intergovernmental Panel on Climate Change (IPCC). (2018). Global warming of 1.5 ºC. URL: https://www.ipcc.ch/site/ assets/uploads/sites/2/2019/06/SR15_Full_Report_High_Res.pdf. Accessed 01 November 2023.
38. Van Valkengoed A.M., Steg L., Perlaviciute G. (2023). The psychological distance of climate change is overestimated. One Earth. 6: 362-391. [DOI: 10.1016/j.oneear.2023.03.006] [DOI:10.1016/j.oneear.2023.03.006]
39. Yılmaz A., Bayav A. (2023). Determination of energy efficiency in almond production according to variety: A case study in Turkey. Erwerbs-Obstbau. 65: 971-979. [DOI: 10.1007/ s10341-022-00728-0] [DOI:10.1007/s10341-022-00728-0]
| Rights and permissions | |
 |
This work is licensed under a Creative Commons Attribution-NonCommercial 4.0 International License. |
