

Volume 11, Issue 2 (June 2024)
J. Food Qual. Hazards Control 2024, 11(2): 82-93 |
Back to browse issues page


Ethics code: 0000
Download citation:
BibTeX | RIS | EndNote | Medlars | ProCite | Reference Manager | RefWorks
Send citation to:


BibTeX | RIS | EndNote | Medlars | ProCite | Reference Manager | RefWorks
Send citation to:
Meghzili B, Benyahia F, Szkolnicka K, Aissaoui-Zitoun O, Foufou E. Soft Cheese-Making with Buttermilk: Physico-chemical, Sensory, Textural Properties, and Microstructure Characterization. J. Food Qual. Hazards Control 2024; 11 (2) :82-93
URL: http://jfqhc.ssu.ac.ir/article-1-1162-en.html
URL: http://jfqhc.ssu.ac.ir/article-1-1162-en.html


Agro-Food Engineering Laboratory (GENIAAL), Institute de la Nutrition, de l'Alimentation et des Technologies Agro-Alimentaires (INATAA) University Mentouri Constantine 1 (UFMC1), Route Ain El Bey, Constantine-25000, Algeria , meghzili.batoul@umc.edu.dz
Full-Text [PDF 726 kb]
(971 Downloads)
| Abstract (HTML) (1772 Views)
Full-Text: (253 Views)
Soft Cheese-Making with Buttermilk: Physico-chemical, Sensory, Textural Properties, and Microstructure Characterization
B. Meghzili 1** , F.A. Benyahia 1, K. Szkolnicka 2, O. Aissaoui-Zitoun 1, E. Foufou 3
1. Agro-Food Engineering Laboratory (GENIAAL), Institute de la Nutrition, de l'Alimentation et des Technologies Agro-Alimentaires (INATAA) University Mentouri Constantine 1 (UFMC1), Route Ain El Bey, Constantine-25000, Algeria
2. Department of Toxicology, Dairy Technology and Food Storage, Faculty of Food Sciences and Fisheries, West Pomeranian University of Technology, Szczecin, Poland
3. Department of nutrition and food technology, University of Jordan, Amman11942, Jordan
HIGHLIGHTS:
Table 1: Different proportions of buttermilk and Cow Milk using for making camembert
Table 2: physico-chemical characteristic of cheese samples
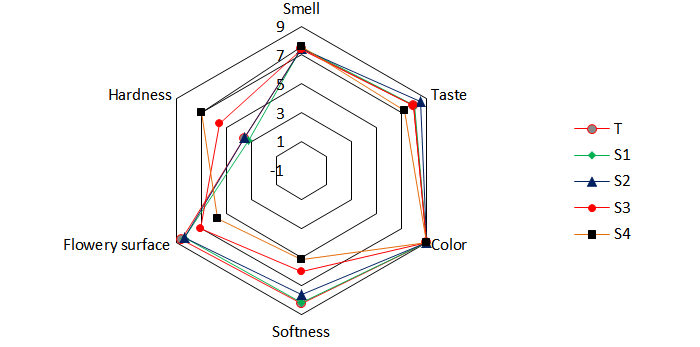
Figure 1: Sensory profile analysis of control and buttermilk samples
T=control sample (100% cow milk)
S1=90% cow milk+10% buttermilk
S2=70% cow milk+30% buttermilk
S3=50% cow milk+50% buttermilk
S4=70% cow milk+30% buttermilk
Table 3: Sensory properties of camembert cheese
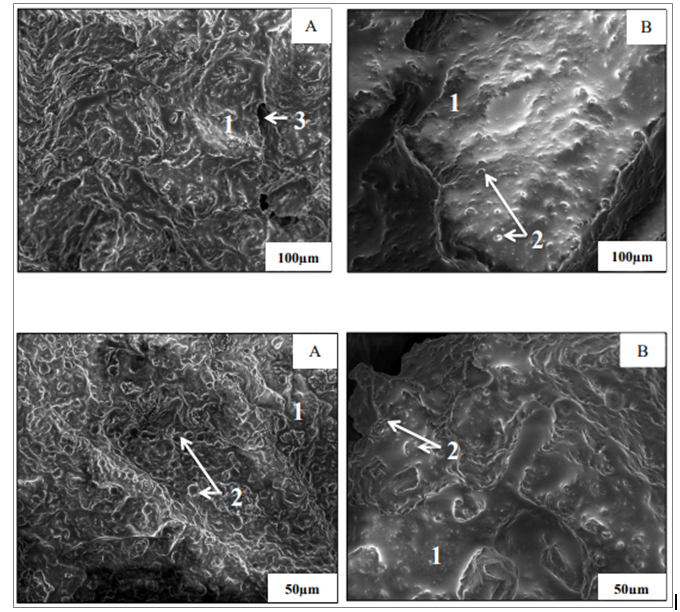
Figure 2: Scanning Electron Microscopy (SEM) of camembert cheese A (100% cow milk) and camembert cheese B (90% cow milk+10% buttermilk) after 12 days d of ripening
1: protein matrix; 2: fat; 3: whey
Table 4: Texture Profile Analysis (TPA) parameters of buttermilk camembert cheese and control sample
Different letters in superscript indicate statistically significant (p≤0.05) differences between mean values in columns (lowercase letters) and in rows (uppercase letters).
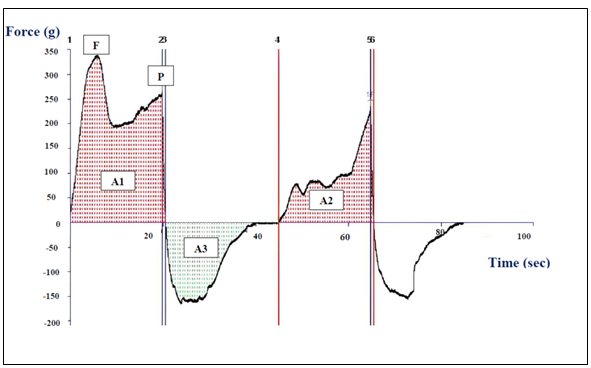
Figure 3: Texture profile Analysis (TPA) curve for camembert cheese made from 100% cow milk. The calculation of textural properties: P=Hardness (N); F=Fracturability (N); A2/A1=Cohesiveness; A3=Adhesiveness (g⋅s); Chewiness=hardness×cohesiveness×springiness (N)
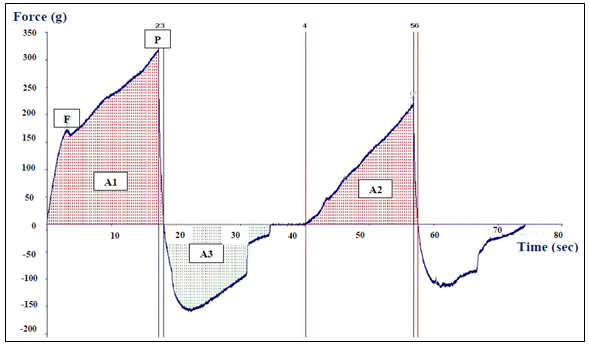
Figure 4: Texture profile Analysis (TPA) curve for camembert cheese made from 90% cow milk and 10% buttermilk. The calculation of textural properties: P=Hardness (N); F=Fracturability (N); A2/A1=Cohesiveness; A3=Adhesiveness (g⋅s); chewiness=hardness×cohesiveness×springiness (N)
B. Meghzili 1**
1. Agro-Food Engineering Laboratory (GENIAAL), Institute de la Nutrition, de l'Alimentation et des Technologies Agro-Alimentaires (INATAA) University Mentouri Constantine 1 (UFMC1), Route Ain El Bey, Constantine-25000, Algeria
2. Department of Toxicology, Dairy Technology and Food Storage, Faculty of Food Sciences and Fisheries, West Pomeranian University of Technology, Szczecin, Poland
3. Department of nutrition and food technology, University of Jordan, Amman11942, Jordan
- Buttermilk is alternative raw material in the manufacture of soft cheese type camembert.
- The acidic buttermilk used in cheese making affects production yield and texture, notably hardness.
- Sensory analysis of camembert cheese with buttermilk shows an acceptable and satisfactory flavor profile.
- Camembert cheese with buttermilk has a tight fusion and dense protein matrix.
| Article type Original article |
ABSTRACT Background: Buttermilk, a significant by-product of the dairy industry, is acknowledged as a beneficial food due to its content of water-soluble vitamins, polar lipids, and milk fat globule membranes. This research is focused on investigating the potential of buttermilk as a substitute in the production of a novel soft cheese type ‘‘camembert’’. Methods: A total of 12 cheese samples of camembert cheese, both with and without buttermilk, were prepared and subjected to a series of physico-chemical analyses in October 2023 to measure protein, fat, total solids, pH, and production yield. Texture Profile Analysis was applied to evaluate textural characteristics, and the microstructure was examined using Scanning Electron Microscopy. A hedonic scale was employed in sensory evaluation to measure taste intensity. Results: The sample containing 90% cow's milk and 10% buttermilk exhibited the most significant (p≤0.05) physico-chemical characteristics as production yield of 45.33%±0.710, protein content of 28.9%±0.58, fat content of 24.88%±0.026, total solids of 54.62±0.23, and a pH of 6.42±0.58. Sensory evaluations demonstrated that camembert samples containing buttermilk were distinguished by high sensory quality and satisfactory taste profiles. In addition, a dense and tightly fused protein matrix was observed in the microstructure of the buttermilk fortified cheese. The results also emphasized that the acidic nature of buttermilk significantly affected the production yield, total solids content, and textural characteristics, evidenced by a hardness of 3.36 N and fracturability of 1.75 N. Conclusion: The results validate the use of buttermilk as an effective alternative in the production of a new type of soft cheese, manifesting improved sensory, structural, and physico-chemical characteristics. This investigation supports the innovative utilization of buttermilk in cheese production, potentially offering a valuable avenue for dairy industry by-products. © 2024, Shahid Sadoughi University of Medical Sciences. This is an open access article under the Creative Commons Attribution 4.0 International License. |
|
| Keywords Buttermilk Cheese Microscopy, Electron, Scanning Dairying Milk Fat Globule |
||
| Article history Received: 28 Dec 2023 Revised: 5 Apr 2024 Accept: 30 May 2024 |
||
| Acronyms and abbreviations MFGM=Milk Fat Globule Membrane TPA=Texture Profile Analysis |
To cite: Meghzili B., Benyahia F.A., Szkolnicka K., Aissaoui-Zitoun O., Foufou E. (2024). Soft cheese-making with buttermilk: physico-chemical, sensory, textural properties, and microstructure characterization. Journal of Food Quality and Hazards Control. 11: 82-93.
Introduction
The dairy industry provides a significant volume of by-products, with buttermilk being of particular importance due to its superior nutritional and technological properties. This has attracted considerable attention from food scientists. Buttermilk, which is a by-product of butter manufacturing, typically consists of 3.6-6.7% lactose, 2.4-3.5% proteins, 0.5-1.5% lipids, 0.6-0.8% ash, and 0.1-0.2% polar lipids from the Milk Fat Globule Membrane (MFGM). Remarkably, the concentration of MFGM in buttermilk is approximately five times higher than in whole milk (Ali, 2019; Krebs et al., 2024; Vanderghem et al., 2010). Buttermilk is considered as a valuable component of functional foods due to its high content of polar lipids and the presence of MFGM proteins, comprising approximately 19% of buttermilk proteins (Conway et al., 2013; Vanderghem et al., 2010). Studies have indicated that polar lipids possess anti-inflammatory and cholesterol-reducing effects (El-Loly, 2011; Liutkevičius et al., 2016). Moreover, buttermilk serves as an excellent source of bioactive elements including linoleic acid, essential fatty acids, and vitamins B12 and riboflavin. It further provides essential minerals such as calcium, phosphorus, and potassium (Ali, 2019; Vanderghem et al., 2010). Buttermilk is categorized into two forms depending on its level of acidity: sweet buttermilk is produced by churning fresh, unfermented cream, and acidic buttermilk, which results from fermenting cream with thermophilic and mesophilic Lactic Acid Bacteria (LAB). However, widespread use of acidic buttermilk as a co-product has enhanced because of its valuable compounds, which significantly improve the quality of products containing buttermilk (Mazzutti et al., 2021). In this context, the concept of buttermilk valorisation and the integration of this by-product into dairy products, mainly cheese production, has emerged.
Cheese is acknowledged as a source of fundamental nutrients and bioactive compounds. Various studies have investigated ways to enrich the nutritional quality of cheese, as particular strains of bacteria or yeast, such as Lactobacillus rhamnosus, Bifidobacterium lactis, and Saccharomyces boulardii are reported to confer health benefits as consumed in adequate amounts (Rashmi and Gayathri, 2017).
Camembert cheese, a surface-ripened mold cheese identified by a white bloomy rind, is traditionally prepared from raw milk in the Camembert region of Normandy, France. Known for its quick ripening process, the cheese's high moisture content facilitates the swift proliferation of surface mold. During ripening process, the texture and flavor of the cheese is significantly altered by enzymatic reactions, and chemical transformations. The main fungal starters used in the camembert production are Penicillium camemberti and Geotrichum candidum, which are commercially accessible. Categorized as a lactic cheese, camembert utilizes both lactic and ripening ferments in its production. It has a soft, pliable, and smooth texture and typically has a moisture content of over 50%. The cheese commonly displays an ivory color and has a balanced flavor with buttery aromas which can occasionally turn rancid. Camembert can have a fat content ranging from 25 to 75% and takes 2 to 6 weeks to mature. (Batty et al., 2019; Galli et al., 2016).
Replacing milk with buttermilk in the process of cheese production may create new opportunities for utilizing this by-product (Skryplonek et al., 2019). Incorporating buttermilk into soft cheese matrices is crucial for the sustainability of dairy industries due to economic and environmental concerns. Despite the favorable features of buttermilk as a raw material for cheese production, there is still limited research on its potential use as an ingredient for camembert cheese production. The use of buttermilk in cheese production not only enhances the nutritional and sensory qualities of the cheese but also provides a sustainable approach that promotes both environmental and economic sustainability. In line with global initiatives to reduce food waste and enhance resource recycling within food systems, this methodology represents considerable value to the dairy industry. Therefore, the main objective of this study is to evaluate the valorization of liquid buttermilk as a partial alternative for cow's milk in the production of soft cheese like camembert. This research concentrates on a comprehensive assessment of the cheese's technological features including physico-chemical parameters, sensory attributes, textural characteristics, as well as microstructural features.
Materials and methods
Camembert cheese-making process
Twelve cheese samples were produced in October 2023 from acid buttermilk made from fermented butter with mesophilic ferments and milk using triple replication formulas. In addition, acontrol cheese (T) was manufactured in triplicate. Table 1 illustrates various concentrations of buttermilk and cows' milk used in the production of camembert cheese.
Table 1: Different proportions of buttermilk and Cow Milk using for making camembert
| Treatment | Cow Milk % | Buttermilk % | |
| T S1 S3 S2 S4 |
100 90 50 70 30 |
0 10 50 30 70 |
The production of camembert cheese involves a precise protocol, initiating with the heating of milk and buttermilk to 40 °C. The mixture was subsequently inoculated with mesophilic starter cultures (DI-PROX® M 229: Lactococcus lactis cremoris, L. lactis diacetylactis, and Leuconostoc mesenteroides) and ripening cultures of G. candidum and P. candidum (AROMA-PROX® GC 064, PC SAM3 LYO 10 D), and maintained at 37 °C. Coagulation was induced as the pH reached 5.5 using Microbial Rennet Granular extracted from Rhizomucor miehei (1: 150,000) and lasted 60 min. The coagulum was then manually cut into small cubes using a cutter, and placed in round molds measuring 10 cm in diameter and 8 cm in height. After being left to drain for 24 h at room temperature, the cheese was flipped three times every 30 min. Afterwards, the cheese was removed from the molds and brined for 15-20 min in a 24 g/L salt solution. It was then transferred to a ripening room set at 12 °C with 90-95% relative humidity for a period of 12 days. The cheeses were ultimately prepared and stored at 4 °C for subsequent analyses.
Camembert cheese analyses
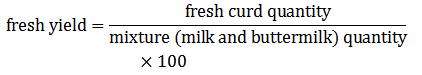
-Cheese yield
The Cheese yield was calculated using Michalski et al. (2004); the results were presented g/100 g of cheese using this formuls:
-Physico-chemical analyses
The physic-chemical analyses using Kjeldahl for protein, Gerber for fat content, total solid (AOAC, 1995), and pH respectively for all cheese sample prepared as mentioned earlier. All experiments were conducted three times.
-Sensory evolution
Camembert quality was evaluated by thirteen expert panelists comprising of an equal number of 15 men and 15 women, aged between 25 and 45. Each panelist received 10 g of camembert cheese samples, which were refrigerated and coded (T, S1, S2, S3, S4). Panelists were instructed to rinse their mouths with water between the evaluations of each sample to avoid flavor carryover. Camembert quality attributes including smell, taste, color, softness, flowery surface, and hardness were assessed using a nine-point hedonic scale, ranging from 1 (very dislike) to 9 (extremely like), after 12 days of ripening. Following the methodology outlined by Clark et al. (2009), panelists rated each attribute on this scale and the combined scores of all panelists were averaged to present a comprehensive evaluation of camembert quality over time.
-Scanning Electron Microscopy (SEM)
The three-dimensional structure of the camembert samples was analyzed using an Inspest F50-FEI scanning electron microscope (Eindhoven, The Netherlands). According to the method established by McDowell and Trump (1976), Camembert slices of 4 to 6 mm thickness were initially fixed on an inert support and treated for 48 h at 4 °C with a mixture of gluteraldehyde and formaldehyde (Fisher Scientific, Germany). After fixation, the cheese samples were mounted on a sample holder and glued in place. The samples were then sputter-coated with platinum using an Emitch 550X sputter coater (Emitech, United Kingdom). The micrographs were observed at a low voltage of 3 kV to capture the intricate details of the cheese’s structure.
-Cheese Texture Profile Analysis (TPA)
During this analysis, the cheeses were placed in boxes with a diameter of 35 mm and a height of 20 mm. Prior to analysis, the samples were maintained at 20 °C for 1 h. The TA.XT plus (Stable Micro System, Godalming, UK), texture analyzer was utilized to analyze texture profile of cheese with 5 cm×5 heigh/d. The TPA contained measurements of hardness, adhesiveness, chewiness, cohesiveness, and fracturability during two compression cycles. The main result indicated that hardness, which reflects the cheese's firmness, is determined during the initial compression as a uniform camembert sample is compressed twice by a probe to a specific height, adhesiveness measures the effort required to detach the cheese from surfaces, chewiness is influenced by hardness, cohesiveness, examined the cheese's structural integrity, measuring its ability to withstand under repeated compressions before breaking, reflecting how well it sticks together during multiple chewings and fracturability indicated the cheese’s tendency to fracture under pressure. These measurements are commonly conducted using a 6 mm diameter aluminum probe at a speed of 5 m/s and a trigger force of 1 G.
Statistical analysis
Data was recorded as the means of triplicate for all physico-chemical analyses and five repetitions for textural analyses. The results were statistically analyzed by Tukey’s Honestly Significant Difference (HSD) test and (ANOVA) at p≤0.05 level of significance using statistical Minitab software 2018 (Minitab Inc., State Collage PA, USA).
Results
Physico-chemical characteristic of cheese samples
Physico-chemical characteristic of camembert cheese samples are showed in Table 2.
-Production yield
In the production of camembert cheese using a combination of buttermilk and milk, the observed yield varied significantly, ranging from 15.33 to 45.33%, as demonstrated in Table 2, production yield were significantly different between the treatments. The highest yield was recorded for sample S1, which comprised of 90% milk and 10% buttermilk, achieving a production yield exceeding 45.33%. Conversely, the sample designated as S4, which was composed of 70% buttermilk and 30% milk, exhibited the lowest yield, registering at 15.33%. These findings highlight the impact of the buttermilk-to-milk ratio on the effectiveness of cheese production.
Camembert cheese analyses
-Cheese yield
The Cheese yield was calculated using Michalski et al. (2004); the results were presented g/100 g of cheese using this formuls:
-Physico-chemical analyses
The physic-chemical analyses using Kjeldahl for protein, Gerber for fat content, total solid (AOAC, 1995), and pH respectively for all cheese sample prepared as mentioned earlier. All experiments were conducted three times.
-Sensory evolution
Camembert quality was evaluated by thirteen expert panelists comprising of an equal number of 15 men and 15 women, aged between 25 and 45. Each panelist received 10 g of camembert cheese samples, which were refrigerated and coded (T, S1, S2, S3, S4). Panelists were instructed to rinse their mouths with water between the evaluations of each sample to avoid flavor carryover. Camembert quality attributes including smell, taste, color, softness, flowery surface, and hardness were assessed using a nine-point hedonic scale, ranging from 1 (very dislike) to 9 (extremely like), after 12 days of ripening. Following the methodology outlined by Clark et al. (2009), panelists rated each attribute on this scale and the combined scores of all panelists were averaged to present a comprehensive evaluation of camembert quality over time.
-Scanning Electron Microscopy (SEM)
The three-dimensional structure of the camembert samples was analyzed using an Inspest F50-FEI scanning electron microscope (Eindhoven, The Netherlands). According to the method established by McDowell and Trump (1976), Camembert slices of 4 to 6 mm thickness were initially fixed on an inert support and treated for 48 h at 4 °C with a mixture of gluteraldehyde and formaldehyde (Fisher Scientific, Germany). After fixation, the cheese samples were mounted on a sample holder and glued in place. The samples were then sputter-coated with platinum using an Emitch 550X sputter coater (Emitech, United Kingdom). The micrographs were observed at a low voltage of 3 kV to capture the intricate details of the cheese’s structure.
-Cheese Texture Profile Analysis (TPA)
During this analysis, the cheeses were placed in boxes with a diameter of 35 mm and a height of 20 mm. Prior to analysis, the samples were maintained at 20 °C for 1 h. The TA.XT plus (Stable Micro System, Godalming, UK), texture analyzer was utilized to analyze texture profile of cheese with 5 cm×5 heigh/d. The TPA contained measurements of hardness, adhesiveness, chewiness, cohesiveness, and fracturability during two compression cycles. The main result indicated that hardness, which reflects the cheese's firmness, is determined during the initial compression as a uniform camembert sample is compressed twice by a probe to a specific height, adhesiveness measures the effort required to detach the cheese from surfaces, chewiness is influenced by hardness, cohesiveness, examined the cheese's structural integrity, measuring its ability to withstand under repeated compressions before breaking, reflecting how well it sticks together during multiple chewings and fracturability indicated the cheese’s tendency to fracture under pressure. These measurements are commonly conducted using a 6 mm diameter aluminum probe at a speed of 5 m/s and a trigger force of 1 G.
Statistical analysis
Data was recorded as the means of triplicate for all physico-chemical analyses and five repetitions for textural analyses. The results were statistically analyzed by Tukey’s Honestly Significant Difference (HSD) test and (ANOVA) at p≤0.05 level of significance using statistical Minitab software 2018 (Minitab Inc., State Collage PA, USA).
Results
Physico-chemical characteristic of cheese samples
Physico-chemical characteristic of camembert cheese samples are showed in Table 2.
-Production yield
In the production of camembert cheese using a combination of buttermilk and milk, the observed yield varied significantly, ranging from 15.33 to 45.33%, as demonstrated in Table 2, production yield were significantly different between the treatments. The highest yield was recorded for sample S1, which comprised of 90% milk and 10% buttermilk, achieving a production yield exceeding 45.33%. Conversely, the sample designated as S4, which was composed of 70% buttermilk and 30% milk, exhibited the lowest yield, registering at 15.33%. These findings highlight the impact of the buttermilk-to-milk ratio on the effectiveness of cheese production.
Table 2: physico-chemical characteristic of cheese samples
| Samples | T | S1 | S2 | S3 | S4 |
| Protein% | 28.46±0.315 a | 28.9±0.58 a | 28.2±0.125 a | 27.53±0.710 a | 26.3±1.162 a |
| Fat % | 21.333±0.57 b | 24.88±0.026 b | 25±0.005 b | 25±0.115 b | 23±0.00577 b |
| Total Solid (%) | 45.99±0.32 c | 54.62±2.30 c | 49.19±0.421 c | 62.11±3.49 c | 65.55±0.595 c |
| pH | 6.15 ±0.249 d | 6.42±0.58 d | 5.87±0.081 d | 5.33±0.5033 d | 6.03±0.112 d |
| Production yield (%) | 53.75±1.29 a | 45.33±0.710 a | 30.33±1.15 a | 26.23±1.52 b | 15.33±0.75 b |
T=control sample (100% cow milk)
S1=90% cow milk+10% buttermilk
S2=70% cow milk+30% buttermilk
S3=50% cow milk+50% buttermilk
S4=70% cow milk+30% buttermilk
Mean±Standard Deviation (SD) having different superscript letters in rows are significantly different (p≤0.05).
S1=90% cow milk+10% buttermilk
S2=70% cow milk+30% buttermilk
S3=50% cow milk+50% buttermilk
S4=70% cow milk+30% buttermilk
Mean±Standard Deviation (SD) having different superscript letters in rows are significantly different (p≤0.05).
-Protein content (%)
As revealed in Table 2, the protein content between treatments was not significant. In the analysis of the protein content within the various samples of camembert cheese, the sample labeled S1, with a composition of 90% milk and 10% buttermilk, exhibited the highest protein content, measuring at 28.9%±0.58. This value was identical to that of the control sample, which had a protein content of 28.46%±0.315. Conversely, the sample designated as S4, composed of 30% buttermilk and 70% milk, presented the lowest protein content at 26.3%±1.162.
-Total solid
In the production of camembert cheese, incorporating buttermilk into the samples (S4, S3, S1, and S2) resulted in a significant increase in the total solids content. Sample S4 represented the highest total solids content, followed by samples S3, S1, and S2, in descending order. Statistical analysis manifested a significant difference in total solids content between these buttermilk-inclusive samples and the control samples (p≤0.05).
-Fat content
The fat content of the camembert cheese samples was assessed, with samples S1, S2, and S3 having the highest values, whereas the control sample (T) revealed the lowest fat content. Sample S4 recorded an intermediate fat content. Statistical analysis verified significant differences among these values (p≤0.05), highlighting the impact of sample formulation variations on their compositional characteristics.
-pH
The pH values of the cheese samples were analyzed to detect the effect of the different buttermilk additions. The control sample displayed a significant difference in pH only as compared with sample S3, which included a 50% buttermilk addition, indicating a notable deviation (p≤0.05). On the contrary, the addition of 10, 30, and 70% buttermilk to samples S1, S2, and S4, respectively, failed significantly to affect the pH values as compared to the control sample, with all differences falling within non-significant ranges (p≥0.05). This recommends that except for a moderate level of buttermilk addition, smaller or larger proportions refuse markedly to influence the pH of the cheese.
Sensory analysis
Table 3 provides the means and standard deviations of the scores allocated to the various sensory attributes, graphically visualizing the variations between the different cheese formulations. The results prove that cheese formulation S4 and S3 exhibit distinct differences in attributes containing hardness, flavor, surface, and softness in comparison with other samples, S2 and S1, as well as the control sample with 100% milk. These results underline the significant impact of different proportions of the ingredients on the sensory quality of the cheese.
Figure 1: Sensory profile analysis of control and buttermilk samples
T=control sample (100% cow milk)
S1=90% cow milk+10% buttermilk
S2=70% cow milk+30% buttermilk
S3=50% cow milk+50% buttermilk
S4=70% cow milk+30% buttermilk
Table 3: Sensory properties of camembert cheese
| Samples | T1 | S1 | S2 | S3 | S4 |
| Smell | 7.46±0.92 a | 7.5±0.871 a | 7.42±0.76 a | 7.38±0.65 a | 7.61±0.65 a |
| Taste | 8±0.70 a | 8.07±0.64 a | 8.53±0.51 a | 8±0.40 a | 7.30±0.48 a |
| Color | 9±0.00 a | 9±0.00 a | 9±0.00 a | 9±0.00 a | 9±0.00 a |
| Softness | 8.23±0.59 a | 8.15±0.68 a | 7.61±0.65 a | 6±0.50 a | 5.15±0.89 a |
| Flowery surface | 8.60±0.50 a | 8.53±0.51 a | 8.30±0.75 a | 7.07±0.64 b | 5.69±0.48 ac |
| Hardness | 3.5±0.76 a | 3.17±0.67 a | 3.56±0.65 a | 5.51±0.67 b | 7±0.51 b |
T=control sample (100% cow milk)
S1=90% cow milk+10% buttermilk
S2=70% cow milk+30% buttermilk
S3=50% cow milk+50% buttermilk
S4=70% cow milk+30% buttermilk
Data in same rows with different letters are significantly different (p≤0.05).
S1=90% cow milk+10% buttermilk
S2=70% cow milk+30% buttermilk
S3=50% cow milk+50% buttermilk
S4=70% cow milk+30% buttermilk
Data in same rows with different letters are significantly different (p≤0.05).
Microstructure
The micrographs depicted in Figure 2 uncover the microstructural variances in camembert cheese ripened for 12 days, contrasting the reference cheese produced with 100% cow's milk (Figure 2A) to cheese with a 10% addition of buttermilk (Figure 2B). These images reveal a distinct difference in microstructure between the two, demonstrating how even a small proportion of buttermilk can alter the physical features of the cheese. This comparative analysis is essential to comprehend the effects of buttermilk on cheese texture and structure during the ripening process.
The micrographs depicted in Figure 2 uncover the microstructural variances in camembert cheese ripened for 12 days, contrasting the reference cheese produced with 100% cow's milk (Figure 2A) to cheese with a 10% addition of buttermilk (Figure 2B). These images reveal a distinct difference in microstructure between the two, demonstrating how even a small proportion of buttermilk can alter the physical features of the cheese. This comparative analysis is essential to comprehend the effects of buttermilk on cheese texture and structure during the ripening process.
Figure 2: Scanning Electron Microscopy (SEM) of camembert cheese A (100% cow milk) and camembert cheese B (90% cow milk+10% buttermilk) after 12 days d of ripening
1: protein matrix; 2: fat; 3: whey
TPA
The TPA of camembert cheese, comparing the reference cheese made with 100% cow's milk to the samples with a 10% buttermilk addition, is detailed in Figures 3 and 4. These Figures present the textural properties incliding hardness, cohesiveness, adhesiveness, and chewiness. The statistical assessment represented in Table 4, suggests that there is no significant difference (p≥0.05) in the majority of textural attributes between the two samples. Indeed, the significant difference (p≤0.05) is noted just in fracturability.
The TPA of camembert cheese, comparing the reference cheese made with 100% cow's milk to the samples with a 10% buttermilk addition, is detailed in Figures 3 and 4. These Figures present the textural properties incliding hardness, cohesiveness, adhesiveness, and chewiness. The statistical assessment represented in Table 4, suggests that there is no significant difference (p≥0.05) in the majority of textural attributes between the two samples. Indeed, the significant difference (p≤0.05) is noted just in fracturability.
Table 4: Texture Profile Analysis (TPA) parameters of buttermilk camembert cheese and control sample
| Parameters | Hardness (N) | Chewiness (N) | Adhesiveness (g.s) | Cohesiveness | Fracturability (N) |
| Buttermik cheese | 3.36±37.26 a | 1.54±39.83 a | -1660.13±855.05 a | 0.43±0.07 a | 1.76±21.09 b |
| Control T | 3.02±0.56 a | 1.002±0.087 a | -979.74±599.82 a | 0.34±0.06 a | 3.44±33.09 a |
Different letters in superscript indicate statistically significant (p≤0.05) differences between mean values in columns (lowercase letters) and in rows (uppercase letters).
Figure 3: Texture profile Analysis (TPA) curve for camembert cheese made from 100% cow milk. The calculation of textural properties: P=Hardness (N); F=Fracturability (N); A2/A1=Cohesiveness; A3=Adhesiveness (g⋅s); Chewiness=hardness×cohesiveness×springiness (N)
Figure 4: Texture profile Analysis (TPA) curve for camembert cheese made from 90% cow milk and 10% buttermilk. The calculation of textural properties: P=Hardness (N); F=Fracturability (N); A2/A1=Cohesiveness; A3=Adhesiveness (g⋅s); chewiness=hardness×cohesiveness×springiness (N)
Discussion
In the production of camembert cheese, the yield is a crucial factor affected by various factors, including the characteristics of the raw materials like milk and buttermilk. According to Skryplonek et al. (2019), several variables within the cheese-making process substantially affect both the yield and the quality of the final product. It has been noted that an increased proportion of buttermilk to milk correlates with a decrease in production yield. Accordingly, the observed yields ranging from 17.2 to 22.7% in the production of fresh cheese can be ascribed to the lower total solids content of buttermilk, as well as its higher acidity and distinct chemical composition compared to milk. Our findings deviate from those reported by Skryplonek et al. (2019); where they observed reduced yields with increased buttermilk use, our study documented yields decreasing in samples S3 and S4. This notable reduction in yield can be associated with the higher total solids content identified in these samples in comparison with the control sample. The increased total solids content, indicating a higher concentration of solids, recommends lower water retention in the curd because of the altered structural and chemical characteristics of the curd matrix when buttermilk is applied (Fox et al., 2017).
However, the findings suggest that a rise in the buttermilk content in the camembert cheese formulation results in a slight reduction in protein levels in the samples. Alhough, the protein content in all the samples was not significantly affected (p˃0.05) by the inclusion of buttermilk. Protein plays a crucial role in determining the quality and functional characteristics of cheese due to its presence in most cheese varieties (Amenu and Deeth, 2007). Furthermore, including a dairy ingredient such as buttermilk can impact the physico-chemical, rheological, stability, and microstructural characteristics. The nature of this ingredient, particularly as fermented and churned into butter, alters the casein's electric charge, which can modify the cheese's moisture content (McSweeney, 2007). This alteration probably contributes to the observed differences in moisture content and production efficiency, influencing the entire cheese-making pro the final product, which is characterized by denser and less moist curd.
Interestingly, the addition of buttermilk was observed to enhance the fat content of the cheese, supporting the findings of El.Sayed et al. (2010), who investigated the utilization of buttermilk concentrate in the production of functional processed cheese which spread and observed fat that was higher in functional processed cheese incorporation of buttermilk concentrate. Identical findings to our study were reported by Los et al. (2021). Buttermilk can boost the fat content in camembert cheese chiefly since it is derived from the butter-making process, which inherently contains residual milk fat globules in its composition. As buttermilk is added to the cheese milk, these residual fats are incorporated into the cheese matrix. The fat globules in buttermilk are surrounded by a membrane rich in phospholipids and proteins. This membrane not only provides additional fat to the cheese but also introduces beneficial compounds that can affect the texture and flavor of camembert (Fox et al., 2017).Contrary to what might be expected, the use of buttermilk can cause variations in fat content in different types of cheese. For instance, Hickey et al. (2018) reported that cheddar cheese made by blending buttermilk or buttermilk powder with cow's milk contained a fat content of 27%. In comparison, standard cheddar cheese generally involves higher fat levels, particularly approximately 32% fat, as described by Ullah et al. (2018). Therefore, the incorporation of buttermilk into cheddar cheese production resulted in a product with a significantly lower fat content compared to standard cheddar. This decrease in fat typically results in a softer cheese, as less lipid material filling the spaces between the protein networks, which increases the matrix's flexibility (Guinee and Fox, 2004) Additionally, Asif et al. (2023) underlined that the total fat content of cheddar cheese produced with buttermilk exhibited no significant difference in comparison with the control samples. This case suggests that although buttermilk can influence the fat content and consequently the texture of the final product, the effects can vary depending on the type of cheese and the specifics of the cheese-making process.
Moreover, altering the pH level is crucial in determining the functional characteristics of cheese (Szkolnicka et al., 2021). The increase in pH in camembert cheese enriched with buttermilk is primarily caused by the activity of surface molds including Penicillium, which consume lactic acid and generate ammonia, thereby raising the pH. Buttermilk contributes LAB, initially boosting lactic acid production. However, as the cheese ages, surface molds metabolize this lactic acid, resulting in a more complex pH dynamic and an overall increase in pH (Fox et al., 2017). This impact is particularly noticeable in sample S1, which contains 10% concentration of buttermilk. Additionally, the sensory characteristics of cheese particularly as involving the addition of buttermilk, presents diverse results in the literature. While Bahrami et al. (2015) reported that adding buttermilk to milk could deteriorate the sensory features of cream cheese, suggesting a negative impact on taste, texture, and overall appeal, contrasting evidence from Skryplonek et al. (2019) supports a more positive outlook. According to their research, buttermilk is regarded as an appropriate alternative for making soft unripened cheese with good sensory assessment. However, our findings proved that the smell, taste, and color of the cheese, characterized by a pleasant, lactic flavor, and a white flowery surface, were well-received by all panelists and met the criteria for camembert cheese. These traits align well with the requirements of camembert cheese, suggesting that the inclusion of buttermilk can be advantageous in specific situations and formulations. The context in which buttermilk is used, including the processing techniques and the target sensory profile, probably plays a critical role in determining its impact on the final product. Thus, while buttermilk can sometimes detract from sensory quality in certain cheese types such as cream cheese, it can also enhance the sensory profile of other cheese varieties, containing soft unripened cheeses and soft cheese as camembert (Fox et al., 2017).
Consistency in terms of softness and hardness was associated with the quantity of buttermilk in the samples. The cheese produced with low quantity of buttermilk represented by S1 and S2 (10 and 30% of buttermilk, respectively), had higher values of softness and lower values of hardness than the S3 and S4 samples made with 50 and 70% of buttermilk, respectively, and were more identical to the control (T) cheese (Table 3). More pronounced hardness of the S3 and S4 samples of cheese which resulted in a less firm texture in the mouth compared to all other samples, including the control sample, confirms the property to water-binding capacity of buttermilk which can reduce the overall moisture content within the cheese matrix, making it less firm and more brittle. The decrease in moisture is partially due to the different hydration properties of buttermilk proteins and their interaction with water molecules, which can be less efficient compared to regular milk protein, and the firmness in the mouth may be due to the decreased moisture levels and possibly the increase of fat within the cheese matrix (Everett and Auty, 2008). The addition of buttermilk, which may include a lower pH as a result of fermentation processes, can further influence the cheese matrix. The pH level affects the state of casein proteins; lower pH levels can lead to more extensive casein aggregation and a tighter network, contributing to a harder cheese. Furthermore, the cheese exhibiting increased chewiness offered a heightened challenge in terms of palatability.
The microstructure analysis indicated significant differences between the control and buttermilk cheese samples. The control camembert sample (A) demonstrated a typical aggregation of proteins around small, discrete fat globules, establishing a stable network that supports a balanced texture. In contrast, samples with buttermilk (B) revealed a more compact and dense protein structure with regions of coalesced fat, indicating a disruption in the uniform distribution of fat globules. Hussein and Shalaby (2014) and Rahimi et al. (2007) have documented identical findings, where changes in the fat and protein matrix due to different processing or ingredient variations lead to altered textural properties. The reference cheese caused the lipids to aggregate into spherical spaces, probably because of hydrolysis of the casein matrix during the ripening of camembert that holds the fat globules (Feeney et al., 2021). Conversely, a compact fusion and a dense structure of the protein matrix were characteristic of the microstructure of cheese from buttermilk (B). There is evidence of coalesced fat pools and areas of free fat in the buttermilk cheese samples compared to the control sample. Each cheese variety exhibits its structural features which reflect the chemical and biological alterations in the cheese. The number of milk fat globules diminished and the protein matrix became more compact (Rahimi et al., 2007), this probably explained the hard texture observed with the buttermilk cheese varieties even though they were significantly lower in moisture content involved a protein matrix with no noticeable fat. This aligned with the composition of the cheese bases which composed of buttermilk. Hussein and Shalaby (2014) and Rahimi et al. (2007) have recorded comparable results, indicating that the increased density and compactness in the protein matrix of buttermilk variants imply a more interconnected protein network, which associated with the noted increase in hardness.
The textural variations in camembert samples, as determined by TPA notably in terms of hardness and fracturability can be substantially influenced by the selection of raw materials (milk and buttermilk) and the processing methods employed. These differences are probably caused by the increased level of moisture in these products, which could result in incomplete protein precipitation. This incomplete process leads to a looser protein network with numerous air gaps, instead of a dense and compact protein structure. Camembert cheese with 10% buttermilk addition exhibited slightly higher hardness (3.36 N) compared to the control sample (3.02 N) so it demonstrated greater resilience to distortion. This could be explained by the reduction in cheese moisture content; however, this difference was not statistically significant (p>0.05). Harder texture of cheese with higher total solid content is probably caused by the coagulant’s ability to create a denser structure by making protein molecules closer due to loss of water during coagulation step. Correspondingly, Olson (1990) indicated that relative proportions of water, protein, and fat were the dominant factors electing cheese hardness. This relationship between hardness and fracturability was observed in the present study. Buttermilk camembert had greater hardness force with less fracturabilty. It may be explained by the fact that harder texture of cheese protects the cheese rind from cracking.
In addition, the cheese with high chewiness (1.54 N) was more difficult to consume. The texture improvement is a result of the high water-holding capacity of phospholipids present in the buttermilk. These phospholipids bind water more effectively, which not only contributes to a softer texture but also affects the overall eating experience by making the cheese less chewy and easier to consume. Based on Hickey et al. (2018) who tested cheddar cheese with buttermilk addition, a softer texture of low-fat cheese with phospholipids is associated with higher water content and revealed a softer texture connected to higher water content. This interaction demonstrates how the distinct characteristics of buttermilk, particularly its phospholipid content, can modify the textural outcomes of cheese, resulting in significant differences compared to the cheese made with milk alone.
Moreover, buttermilk camembert exhibits decreased fracturability (1.75638 N) in comparison to the control (3.442 N), suggesting it breaks less easily under force. However, significant standard deviations for both samples indicate potential inconsistencies in texture within the buttermilk cheese samples. This justifies that buttermilk's unique components, containing milk fat globules surrounded by protein-rich membranes, enhance the dispersion of fat (Vanderghem et al., 2010). Furthermore, buttermilk's proteins, transformed by fermentation processes, resulting in a looser protein network, which, along with its naturally lower pH, softens the cheese matrix. These factors collectively reduce the cheese's tendency to fracture, making it more resilient under stress and yielding a softer, less rigid camembert (Fox et al., 2017; Morin et al., 2007; Vanderghem et al., 2010). Overall, despite observing slight variances in hardness, chewiness, adhesiveness, cohesiveness, and fracturability between buttermilk and control cheeses, these differences are not statistically significant. The high variability within buttermilk cheese samples recommends potential inconsistencies in the cheese-making process or in the formation of cheese structure with buttermilk use, warranting further investigation for ensuring consistent product quality and the results suggest, that the incorporation of a 10% buttermilk into camembert cheese resulted in a marginally increased hardness compared to the control sample, indicative of enhanced resistance to deformation. This variation in texture is probably attributed to the reduction in cheese moisture content buttermilk dry matter significantly influences cheese structure and texture, influencing firmness, cohesion, and elasticity. Increased dry matter content makes cheese harder, denser, and less adhesive, with reduced moisture affecting chewing and syneresis (Fox et al., 2017; Gunasekaran and Ak, 2002). Dry matter also boosts flavor release, enhancing the taste profile of cheeses with higher dry matter content (McSweeney, 2007). However it is noteworthy that the difference was not statistically significant (p>0.05). The firmer texture observed in the cheese enriched with increased total solid content is plausibly explained by the coagulant's capacity to promote a denser molecular arrangement by bringing protein molecules closer together, facilitated by the reduction of water during coagulation. This is consistent with previous studies such as Olson’s study (1990), highlighting the significant impact of water, protein, and fat proportions on cheese firmness. Noticeably, a correlation between hardness and fracturability was evident in the current investigation.
Conclusion
This research evaluates the use of buttermilk as a substitute for milk in camembert cheese production. The findings indicate that acidic liquid buttermilk is an appropriate raw material for camembert production. The substitution of milk with buttermilk in camembert cheese formulation has physico-chemical attributes identical to the control cheese made with cows' milk. Liquid buttermilk influences yield production, total solids, fat content, and texture, particularly fractubility. The sensory characteristics of color, texture, odour, and taste were appreciated by panelists, aligning with camembert-type cheese requirements. The cheese from buttermilk has a tight fusion and dense protein matrix structure, whereas the control sample features aggregated and spherical network proteins. The study concludes that buttermilk is a viable alternative for by-product utilization and can be readily implemented in the dairy industry. Moreover, it can enhance the nutritional value of camembert cheese. Positive results indicate that utilizing acidic buttermilk results in products with sensory quality comparable to milk-based cheese.
Author contributions
B.M. conducted the experiment, analyzed data, interpreted statistical analysis, and wrote the main draft of the manuscript; F.A.B., K.S., and O.A.-Z. participated in editing of the original draft; E.F. analyzed the data. All authors reviewed and approved the manuscript.
Conflict of interest
The authors declare no conflict of interest.
Acknowledgments
The authors are thankful to Professor Ewa Mijowska, Department of Nanomaterials physico-chemistry, Faculty of Chemical Technology and Engineering, West Pomeranian University of Technology, Szczecin, Poland for providing us with assistance during the analyses of microstructure of cheese
Funding
No funding was received for this study.
Ethical consideration
Not applicable.
References
Ali A.H. (2019). Current knowledge of buttermilk: composition, applications in the food industry, nutritional and beneficial health characteristics. International Journal of Dairy Technology. 72: 169-182. [DOI: 10.1111/1471-0307.12572]
Amenu B., Deeth H.C. (2007). The impact of milk composition on cheddar cheese manufacture. The Australian Journal of Dairy Technology. 62: 171-184.
AOAC. (1995). Official methods of analysis of association of official analytical chemists international. 16th edition. Journal of AOAC International, Arlington, USA. URL: http://lib3.dss.go.th/fulltext/scan_ebook/aoac_1995_v78_n3.pdf.
Asif M., Nadeem M., Imran M., Ullah R., Tayyab M., Khan F.A., Al-Asmari F., Rahim M.A., Rocha J.M., Korma S.A., Esatbeyoglu T. (2023). Effect of fat contents of buttermilk on fatty acid composition, lipolysis, vitamins and sensory properties of cheddar-type cheese. Frontiers in Microbiology. 14: 1209509. [DOI: 10.3389/fmicb.2023.1209509]
Bahrami M., Ahmadi D., Beigmohammadi F., Hosseini F. (2015). Mixing sweet cream buttermilk with whole milk to produce cream cheese. Irish Journal of Agricultural and Food Research. 54: 73-78. [DOI: 10.1515/ijafr-2015-0008]
Batty D., Waite-Cusic J.G., Meunier-Goddik L. (2019). Influence of cheese-making recipes on the composition and characteristics of camembert-type cheese. Journal of Dairy Science. 102: 164-176. [DOI: 10.3168/jds.2018-14964]
Clark S., Costello M., Drake M., Bodyfelt F. (2009). The sensory evaluation of dairy products. 2nd edition. Springer, New York. [DOI: 10.1007/978-0-387-77408-4]
Conway V., Gauthier S.F., Pouliot Y. (2013). Antioxidant activities of buttermilk proteins, whey proteins, and their enzymatic hydrolysates. Journal of Agricultural and Food Chemistry. 61: 364-372. [DOI: 10.1021/jf304309g]
El-Loly M.M. (2011). Composition, properties and nutritional aspects of milk fat globule membrane - a review. Polish Journal of Food and Nutrition Sciences. 61: 7-32. [DOI: 10.2478/v10222-011-0001-0]
El.Sayed M.M., Askar A.A., Hamzawi L.F., Fathy F.A., Mohamed A.G., El Sayed S.M., Hamed I.M. (2010). Utilization of buttermilk concentrates in the manufacture of functional processed cheese spread. Journal of American Science. 6: 876-882.
Everett D.W., Auty M.A.E. (2008). Cheese structure and current methods of analysis. International Dairy Journal. 18: 759-773. [DOI: 10.1016/j.idairyj.2008.03.012]
Feeney E.L., Lamichhane P., Sheehan J.J. (2021). The cheese matrix: understanding the impact of cheese structure on aspects of cardiovascular health – a food science and a human nutrition perspective. International Journal of Dairy Technology. 74:656-670. [DOI : 10.1111/1471-0307.12755]
Fox P.F., Guinee T.P., Cogan T.M., McSweeney P.L.H. (2017). Fundamentals of cheese science. 2nd edition. Springer, New York. [DOI: 10.1007/978-1-4899-7681-9]
Galli B.D., Martin J.G.P., Da Silva P.P.M., Porto E., Spoto M.H.F. (2016). Sensory quality of camembert-type cheese: relationship between starter cultures and ripening molds. International Journal of Food Microbiology. 234: 71-75. [DOI: 10.1016/ j. ijfoodmicro.2016.06.025]
Guinee T.P., Fox P.F. (2004). Salt in cheese: physical, chemical and biological aspects. Cheese: Chemistry, Physics and Microbiology. 1: 207-259. [DOI: 10.1016/S1874-558X(04)80069-1]
Gunasekaran S., AK M.M. (2002). Cheese rheology and texture. 1st edition. CRC Press, Boca Raton. [DOI: 10.1201/9781420031942]
Hickey C.D., O'Sullivan M.G., Davis J., Scholz D., Kilcawley K.N., Wilkinson M.G., Sheehan J.J. (2018). The effect of buttermilk or buttermilk powder addition on functionality, textural, sensory and volatile characteristics of cheddar-style cheese. Food Research International. 103: 468-477. [DOI: 10.1016/ j.foodres.2017.09.081]
Hussein G.A.M., Shalaby S.M. (2014). Microstructure and textural properties of Kareish cheese manufactured by various ways. Annuals of Agricultural Sciences. 59: 25-31. [DOI: 10.1016/j.aoas.2014.06.004]
Krebs L., Larouche J., Remondetto G.E., Chamberland J., Venema K., Brisson G. (2024). The effect of concentrated buttermilk on cheese milk rennet-induced coagulation and rheological properties at various buttermilk to skim milk ratios. Food Hydrocolloids. 150: 109664. [DOI: 10.1016/j.foodhyd.2023.109664]
Liutkevičius A., Speičienė V., Alenčikienė G., Mieželienė A., Narkevičius R., Kaminskas A., Abaravičius J.A., Vitkus D., Jablonskienė V., Sekmokienė D. (2016). Fermented buttermilk-based beverage: impact on young volunteers’ health parameters. Czech Journal of Food Sciences. 34: 143-148. [DOI: 10.17221/344/2015-CJFS]
Los P.R., Simões D.R.S., Benvenutti L., Zielinski A.A.F., Alberti A., Nogueira A. (2021). Combining chemical analysis, sensory profile, CATA, preference mapping and chemometrics to establish the consumer quality standard of camembert-type cheeses. International Journal of Dairy Technology. 74: 371-382. [DOI: 10.1111/1471-0307.12753]
Mazzutti S., Pedrosa R.C., Ferreira S.R.S. (2021). Green processes in foodomics. supercritical fluid extraction of bioactives. Comprehensive Foodomics. 725-743. [DOI: 10.1016/B978-0-08-100596-5.22816-3]
McDowell E.M., Trump B.F. (1976). Histologic fixatives suitable for diagnostic light and electron microscopy. Archives of Pathology and Laboratory Medicine. 100: 405-414.
McSweeney P.L.H. (2007). Cheese problems solved. 1st edition. Woodhead Publishing Limited and CRC Press, England.
Michalski M.-C., Camier B., Briard V., Leconte N., Gassi J.-Y., Goudédranche H., Michel F., Fauquant J. (2004). The size of native milk fat globules affects physico-chemical and functional properties of emmental cheese. Lait. 84: 343-358. [DOI: 10.1051/lait:2004012]
Morin P., Jiménez-Flores R., Pouliot Y. (2007). Effect of processing on the composition and microstructure of buttermilk and its milk fat globule membranes. International Dairy Journal. 17: 1179-1187. [DOI: 10.1016/j.idairyj.2007.03.010]
Olson N.F. (1990). Light cheese products: characteristics and economics. Food Technology. 44: 93-96.
Rahimi J., Khosrowshahi A., Madadlou A., Aziznia S. (2007). Texture of low-fat Iranian white cheese as influenced by gum tragacanth as a fat replacer. Journal of Dairy Science. 90: 4058-4070. [DOI: 10.3168/jds.2007-0121]
Rashmi B.S., Gayathri D. (2017). Molecular characterization of gluten hydrolysing Bacillus sp. and their efficacy and biotherapeutic potential as probiotics using Caco-2 cell line. Journal of Applied Microbiology. 123: 759-772. [DOI: 10.1111/jam. 13517]
Skryplonek K., Dmytrów I., Mituniewicz-Małek A. (2019). The use of buttermilk as a raw material for cheese production. International Journal of Dairy Technology. 72: 610-616. [ DOI: 10.1111/1471-0307.12614]
Szkolnicka K., Dmytrów I., Mituniewicz-Małek A. (2021). The characteristics of quark cheese made from buttermilk during refrigerated storage. Foods. 10: 1783. [DOI: 10.3390/foods10081783]
Ullah R., Nadeem M., Imran M., Taj Khan I., Shahbaz M., Mahmud A., Tayyab M. (2018). Omega fatty acids, phenolic compounds, and lipolysis of cheddar cheese supplemented with chia (Salvia hispanica L.) oil. Journal of Food Processing and Preservation. 42: e13566. [DOI: 10.1111/jfpp.13566]
Vanderghem C., Bodson P., Danthine S., Paquot M., Deroanne C., Blecker C. (2010). Milk fat globule membrane and buttermilks: From composition to valorization. Biotechnology, Agronomy and Society and Environment. 14: 485-500.
* Corresponding author (B. Meghzili)
* E-mail: meghzili.batoul@umc.edu.dz
ORCID ID: https://orcid.org/0000-0001-7554-4342
* E-mail: meghzili.batoul@umc.edu.dz
ORCID ID: https://orcid.org/0000-0001-7554-4342
Type of Study: Original article |
Subject:
Special
Received: 23/12/28 | Accepted: 24/05/30 | Published: 24/06/30
Received: 23/12/28 | Accepted: 24/05/30 | Published: 24/06/30
References
1. Ali A.H. (2019). Current knowledge of buttermilk: composition, applications in the food industry, nutritional and beneficial health characteristics. International Journal of Dairy Technology. 72: 169-182. [DOI: 10.1111/1471-0307.12572] [DOI:10.1111/1471-0307.12572]
2. Amenu B., Deeth H.C. (2007). The impact of milk composition on cheddar cheese manufacture. The Australian Journal of Dairy Technology. 62: 171-184.
3. AOAC. (1995). Official methods of analysis of association of official analytical chemists international. 16th edition. Journal of AOAC International, Arlington, USA. URL: http://lib3.dss.go.th/fulltext/scan_ebook/aoac_1995_v78_n3.pdf.
4. Asif M., Nadeem M., Imran M., Ullah R., Tayyab M., Khan F.A., Al-Asmari F., Rahim M.A., Rocha J.M., Korma S.A., Esatbeyoglu T. (2023). Effect of fat contents of buttermilk on fatty acid composition, lipolysis, vitamins and sensory properties of cheddar-type cheese. Frontiers in Microbiology. 14: 1209509. [DOI: 10.3389/fmicb.2023.1209509] [DOI:10.3389/fmicb.2023.1209509] [PMID] [PMCID]
5. Bahrami M., Ahmadi D., Beigmohammadi F., Hosseini F. (2015). Mixing sweet cream buttermilk with whole milk to produce cream cheese. Irish Journal of Agricultural and Food Research. 54: 73-78. [DOI: 10.1515/ijafr-2015-0008] [DOI:10.1515/ijafr-2015-0008]
6. Batty D., Waite-Cusic J.G., Meunier-Goddik L. (2019). Influence of cheese-making recipes on the composition and characteristics of camembert-type cheese. Journal of Dairy Science. 102: 164-176. [DOI: 10.3168/jds.2018-14964] [DOI:10.3168/jds.2018-14964] [PMID]
7. Clark S., Costello M., Drake M., Bodyfelt F. (2009). The sensory evaluation of dairy products. 2nd edition. Springer, New York. [DOI: 10.1007/978-0-387-77408-4] [DOI:10.1007/978-0-387-77408-4]
8. Conway V., Gauthier S.F., Pouliot Y. (2013). Antioxidant activities of buttermilk proteins, whey proteins, and their enzymatic hydrolysates. Journal of Agricultural and Food Chemistry. 61: 364-372. [DOI: 10.1021/jf304309g] [DOI:10.1021/jf304309g] [PMID]
9. El-Loly M.M. (2011). Composition, properties and nutritional aspects of milk fat globule membrane - a review. Polish Journal of Food and Nutrition Sciences. 61: 7-32. [DOI: 10.2478/v10222-011-0001-0] [DOI:10.2478/v10222-011-0001-0]
10. El.Sayed M.M., Askar A.A., Hamzawi L.F., Fathy F.A., Mohamed A.G., El Sayed S.M., Hamed I.M. (2010). Utilization of buttermilk concentrates in the manufacture of functional processed cheese spread. Journal of American Science. 6: 876-882.
11. Everett D.W., Auty M.A.E. (2008). Cheese structure and current methods of analysis. International Dairy Journal. 18: 759-773. [DOI: 10.1016/j.idairyj.2008.03.012] [DOI:10.1016/j.idairyj.2008.03.012]
12. Feeney E.L., Lamichhane P., Sheehan J.J. (2021). The cheese matrix: understanding the impact of cheese structure on aspects of cardiovascular health - a food science and a human nutrition perspective. International Journal of Dairy Technology. 74:656-670. [DOI : 10.1111/1471-0307.12755] [DOI:10.1111/1471-0307.12755]
13. Fox P.F., Guinee T.P., Cogan T.M., McSweeney P.L.H. (2017). Fundamentals of cheese science. 2nd edition. Springer, New York. [DOI: 10.1007/978-1-4899-7681-9] [DOI:10.1007/978-1-4899-7681-9]
14. Galli B.D., Martin J.G.P., Da Silva P.P.M., Porto E., Spoto M.H.F. (2016). Sensory quality of camembert-type cheese: relationship between starter cultures and ripening molds. International Journal of Food Microbiology. 234: 71-75. [DOI: 10.1016/ j. ijfoodmicro.2016.06.025] [DOI:10.1016/j.ijfoodmicro.2016.06.025] [PMID]
15. Guinee T.P., Fox P.F. (2004). Salt in cheese: physical, chemical and biological aspects. Cheese: Chemistry, Physics and Microbiology. 1: 207-259. [DOI: 10.1016/S1874-558X(04)80069-1] [DOI:10.1016/S1874-558X(04)80069-1]
16. Gunasekaran S., AK M.M. (2002). Cheese rheology and texture. 1st edition. CRC Press, Boca Raton. [DOI: 10.1201/9781420031942] [DOI:10.1201/9781420031942]
17. Hickey C.D., O'Sullivan M.G., Davis J., Scholz D., Kilcawley K.N., Wilkinson M.G., Sheehan J.J. (2018). The effect of buttermilk or buttermilk powder addition on functionality, textural, sensory and volatile characteristics of cheddar-style cheese. Food Research International. 103: 468-477. [DOI: 10.1016/ j.foodres.2017.09.081] [DOI:10.1016/j.foodres.2017.09.081] [PMID]
18. Hussein G.A.M., Shalaby S.M. (2014). Microstructure and textural properties of Kareish cheese manufactured by various ways. Annuals of Agricultural Sciences. 59: 25-31. [DOI: 10.1016/j.aoas.2014.06.004] [DOI:10.1016/j.aoas.2014.06.004]
19. Krebs L., Larouche J., Remondetto G.E., Chamberland J., Venema K., Brisson G. (2024). The effect of concentrated buttermilk on cheese milk rennet-induced coagulation and rheological properties at various buttermilk to skim milk ratios. Food Hydrocolloids. 150: 109664. [DOI: 10.1016/j.foodhyd.2023.109664] [DOI:10.1016/j.foodhyd.2023.109664]
20. Liutkevičius A., Speičienė V., Alenčikienė G., Mieželienė A., Narkevičius R., Kaminskas A., Abaravičius J.A., Vitkus D., Jablonskienė V., Sekmokienė D. (2016). Fermented buttermilk-based beverage: impact on young volunteers' health parameters. Czech Journal of Food Sciences. 34: 143-148. [DOI: 10.17221/344/2015-CJFS] [DOI:10.17221/344/2015-CJFS]
21. Los P.R., Simões D.R.S., Benvenutti L., Zielinski A.A.F., Alberti A., Nogueira A. (2021). Combining chemical analysis, sensory profile, CATA, preference mapping and chemometrics to establish the consumer quality standard of camembert-type cheeses. International Journal of Dairy Technology. 74: 371-382. [DOI: 10.1111/1471-0307.12753] [DOI:10.1111/1471-0307.12753]
22. Mazzutti S., Pedrosa R.C., Ferreira S.R.S. (2021). Green processes in foodomics. supercritical fluid extraction of bioactives. Comprehensive Foodomics. 725-743. [DOI: 10.1016/B978-0-08-100596-5.22816-3] [DOI:10.1016/B978-0-08-100596-5.22816-3]
23. McDowell E.M., Trump B.F. (1976). Histologic fixatives suitable for diagnostic light and electron microscopy. Archives of Pathology and Laboratory Medicine. 100: 405-414.
24. McSweeney P.L.H. (2007). Cheese problems solved. 1st edition. Woodhead Publishing Limited and CRC Press, England.
25. Michalski M.-C., Camier B., Briard V., Leconte N., Gassi J.-Y., Goudédranche H., Michel F., Fauquant J. (2004). The size of native milk fat globules affects physico-chemical and functional properties of emmental cheese. Lait. 84: 343-358. [DOI: 10.1051/lait:2004012] [DOI:10.1051/lait:2004012]
26. Morin P., Jiménez-Flores R., Pouliot Y. (2007). Effect of processing on the composition and microstructure of buttermilk and its milk fat globule membranes. International Dairy Journal. 17: 1179-1187. [DOI: 10.1016/j.idairyj.2007.03.010] [DOI:10.1016/j.idairyj.2007.03.010]
27. Olson N.F. (1990). Light cheese products: characteristics and economics. Food Technology. 44: 93-96.
28. Rahimi J., Khosrowshahi A., Madadlou A., Aziznia S. (2007). Texture of low-fat Iranian white cheese as influenced by gum tragacanth as a fat replacer. Journal of Dairy Science. 90: 4058-4070. [DOI: 10.3168/jds.2007-0121] [DOI:10.3168/jds.2007-0121] [PMID]
29. Rashmi B.S., Gayathri D. (2017). Molecular characterization of gluten hydrolysing Bacillus sp. and their efficacy and biotherapeutic potential as probiotics using Caco-2 cell line. Journal of Applied Microbiology. 123: 759-772. [DOI: 10.1111/jam. 13517] [DOI:10.1111/jam.13517] [PMID]
30. Skryplonek K., Dmytrów I., Mituniewicz-Małek A. (2019). The use of buttermilk as a raw material for cheese production. International Journal of Dairy Technology. 72: 610-616. [ DOI: 10.1111/1471-0307.12614] [DOI:10.1111/1471-0307.12614]
31. Szkolnicka K., Dmytrów I., Mituniewicz-Małek A. (2021). The characteristics of quark cheese made from buttermilk during refrigerated storage. Foods. 10: 1783. [DOI: 10.3390/foods10081783] [DOI:10.3390/foods10081783] [PMID] [PMCID]
32. Ullah R., Nadeem M., Imran M., Taj Khan I., Shahbaz M., Mahmud A., Tayyab M. (2018). Omega fatty acids, phenolic compounds, and lipolysis of cheddar cheese supplemented with chia (Salvia hispanica L.) oil. Journal of Food Processing and Preservation. 42: e13566. [DOI: 10.1111/jfpp.13566] [DOI:10.1111/jfpp.13566]
33. Vanderghem C., Bodson P., Danthine S., Paquot M., Deroanne C., Blecker C. (2010). Milk fat globule membrane and buttermilks: From composition to valorization. Biotechnology, Agronomy and Society and Environment. 14: 485-500.
| Rights and permissions | |
 |
This work is licensed under a Creative Commons Attribution-NonCommercial 4.0 International License. |
