

Volume 12, Issue 1 (March 2025)
J. Food Qual. Hazards Control 2025, 12(1): 1-10 |
Back to browse issues page


Ethics code: Not applicable
Download citation:
BibTeX | RIS | EndNote | Medlars | ProCite | Reference Manager | RefWorks
Send citation to:


BibTeX | RIS | EndNote | Medlars | ProCite | Reference Manager | RefWorks
Send citation to:
Şahin S, Garip İ, Türksoy V. Evaluation of some Heavy Metal and Trace Element Contamination in Chicken Meat and Liver Offered for Consumption in Anatolia Province. J. Food Qual. Hazards Control 2025; 12 (1) :1-10
URL: http://jfqhc.ssu.ac.ir/article-1-1239-en.html
URL: http://jfqhc.ssu.ac.ir/article-1-1239-en.html


Department of Medical Pharmacology, Yozgat Bozok University Faculty of Medicine, Yozgat, Turkey , serkan.sahin@bozok.edu.tr
Full-Text [PDF 557 kb]
(859 Downloads)
| Abstract (HTML) (1274 Views)
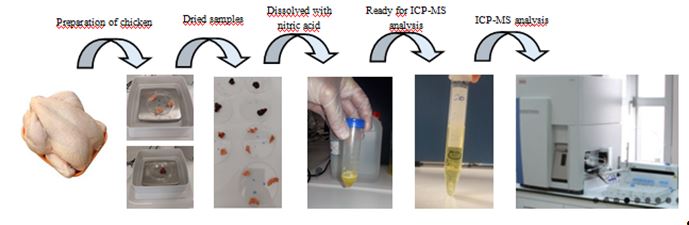
Figure 1: Preparation procedure of chicken samples for Inductively Coupled Plasma-Mass Spectroscopy (ICP-MS) analyses
Table 1: Comparison of metal concentrations in chicken meat and liver samples
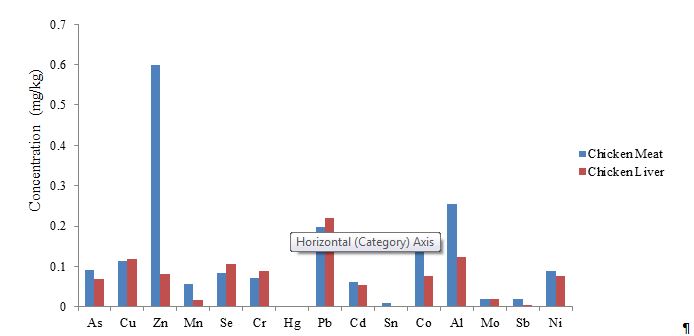
Figure 2: Comparison of mean heavy metal levels in chicken meat and liver
Table 2: Spearman correlations of heavy metal levels in chicken meat
Table 3: Spearman correlations of heavy metal levels in chicken liver
Full-Text: (1551 Views)
Evaluation of some Heavy Metal and Trace Element Contamination in Chicken Meat and Liver Offered for Consumption in Anatolia Province
S. Şahin 1[*]* , İ. Garip 2, V.A. Türksoy 3
1. Department of Medical Pharmacology, Yozgat Bozok University Faculty of Medicine, Yozgat, Turkey
2. Department of Pharmacology and Toxicology, Yozgat Bozok University Faculty of Veterinary, Yozgat, Turkey
3. Department of Public Health, Yozgat Bozok University Faculty of Medicine, Yozgat, Turkey
2. Department of Pharmacology and Toxicology, Yozgat Bozok University Faculty of Veterinary, Yozgat, Turkey
3. Department of Public Health, Yozgat Bozok University Faculty of Medicine, Yozgat, Turkey
HIGHLIGHTS
- Zinc (Zn) levels were highest in chicken meat, while lead (Pb) was more prevalent in chicken liver samples.
- Heavy metals varied significantly between chicken meat and liver (p<0.01 for several elements).
- Monitoring heavy metal contamination in poultry is crucial for the protection of public health.
| Article type Original article |
ABSTRACT Background: Heavy metals are ubiquitous in nature and can enter the food chain through various pathways, posing significant risks to human health. This study aimed to determine the levels of heavy metals in chicken meat and liver available for consumption in local markets of the Anatolia province. Methods: A total of 21 samples (15 chicken meat and six chicken liver) from 11 randomly selected markets in Yozgat, Turkey, were collected during May 2021. Metals (arsenic (As), copper (Cu), zinc (Zn), manganese (Mn), selenium (Se), chromium (Cr), mercury (Hg), lead (Pb), cadmium (Cd), tin (Sn), cobalt (Co), aluminum (Al), molybdenum (Mo), antimony (Sb), and nickel (Ni)) were analyzed using Inductively Coupled Plasma-Mass Spectrometer. The analysis focused on detecting food contamination in thawed chicken meat and liver samples. Data were statistically analyzed using SPSS software (version 25.0). Kolmogorov-Smirnov test assessed normality, and since the data were not normally distributed, the Mann-Whitney U test was applied to compare groups. Spearman correlation analysis was employed to evaluate relationships between heavy metals. Results: The highest concentration was detected for Zn in chicken meat (33.53±5.24 mg/kg), whereas Pb was predominant in liver samples (0.28±0.10 mg/kg). Significant differences were observed between chicken meat and liver in terms of Cr, Mn, Zn, As, and Sn levels (p<0.01) and Al, Co, and Se levels (p<0.05). The Pb and Cd concentrations in chicken meat exceeded the maximum permissible limits set by both the World Health Organization and Turkish Food Codex Contaminants Regulation, while liver samples remained within these limits. Correlation analysis revealed strong positive correlations between Mn and Co (r=0.813; p<0.01) and negative correlations between Cu and Hg (r=-0.639; p<0.05). Conclusion: Monitoring heavy metal contamination in poultry is vital for public health. The results underscore the necessity for stricter control measures in food safety regulations. © 2025, Shahid Sadoughi University of Medical Sciences. This is an open access article under the Creative Commons Attribution 4.0 International License. |
|
| Keywords Metals, Heavy Food Contamination Poultry Meat Environmental Exposure. |
||
| Article history Received: 20 Jul 2024 Revised: 10 Oct 2024 Accept: 27 Jan 2025 |
||
| Abbreviations ICP-MS=Inductively Coupled Plasma-Mass Spectroscopy TFCCR=Turkish Food Codex Contaminants Regulation WHO=World Health Organization |
To cite: Şahin S., Garip İ., Türksoy V.A. (2025). Evaluation of some heavy metal and trace element contamination in chicken meat and liver offered for consumption in Anatolia province. Journal of Food Quality and Hazards Control. 12: 1-10.
Introduction
Introduction
Rapid industrialization and urbanization have led to heightened environmental pollution, particularly in soil and water, reaching levels that pose a substantial threat to ecosystems and public health. Heavy metals are among the most concerning environmental pollutants due to their persistence, bioaccumulation, and toxic effects. Through soil and water contamination, these metals enter the food chain, ultimately accumulating in edible plants and animal products. This bioaccumulation raises concerns regarding food safety and human health risks (Türközü and Şanlıer, 2012). According to the Codex Alimentarius Commission, food contaminants are defined as substances not intentionally added to food but present due to environmental exposure at various stages, including crop farming, animal husbandry, veterinary practices, food manufacturing, processing, packaging, transportation, and storage (Fortin, 2023; Ilyasu et al., 2024). Among these contaminants, heavy metals are of particular concern due to their toxicological effects on human health ( Türközü and Şanlıer, 2012).
Heavy metals can enter the human body through various routes, including food consumption, inhalation, and dermal contact. While certain trace elements, such as zinc (Zn), copper (Cu), and selenium (Se), are essential for metabolic functions, excessive accumulation can lead to severe health consequences. Toxic heavy metals, including lead (Pb), cadmium (Cd), mercury (Hg), and arsenic (As), have been associated with multiple organ toxicity, carcinogenicity, and developmental disorders (Yerli et al., 2020).
The harmful effects of heavy metals entering the human body through various routes can be summarized as follows: As may cause liver enlargement, anemia, brown spots on the skin, and various skin diseases. High levels of As have been reported to induce bone and respiratory system cancers. Although Cu is an essential element for the development of hair, skin, bones, and certain internal organs, excessive amounts can slow growth and development, cause hair graying, lower body temperature, and lead to brain damage. Elevated Hg levels are known to cause kidney damage, nervous system impairment, miscarriages during pregnancy, and fetal abnormalities. Zn toxicity from high doses can result in ulceration, lung edema, and irritation of the mucous membranes and respiratory tract (Yerli et al., 2020). Due to its neurotoxic effects, aluminum (Al) has been shown to be associated with Alzheimer's disease, dementia, and cognitive impairment (Sipahi et al., 2015). Cd causes osteoporosis and dental diseases, lung, and prostate cancer (Sahin et al., 2025; Yerli et al., 2020). It also causes low birth weights by affecting the fetus (Turksoy et al., 2019). Cobalt (Co) can cause lung cancer. High levels of chromium (Cr) intake may lead to upper respiratory tract diseases, asthma, and nasal bleeding due to tissue damage. Pb accumulates in bones and other organs, causing damage to the kidneys, brain, and nervous system. Manganese (Mn) exposure has been linked to Parkinson's disease (Aschner et al., 2009; Şahin et al., 2024). Molybdenum (Mo) can cause amino acid intolerance, brain damage, impaired consciousness, and biochemical abnormalities. Nickel (Ni) exposure may lead to diarrhea, vomiting, shortness of breath, and damage to the liver and kidneys (Yerli et al., 2020). Long-term high intake of Se can cause hair loss, changes in nail morphology, skin lesions (such as redness and swelling), and central nervous system disorders (including paralysis, paresthesia, and hemiplegia). It may also lead to inflammation (Turksoy et al., 2019; WHO, 1996). Antimony (Sb) compounds can cause nausea, vomiting, diarrhea, myalgia, arthralgia, elevated liver enzymes, increased amylase levels, headache, and drowsiness (ATSDR, 2019).
Heavy metals are naturally present in the environment as stable compounds in the form of carbonates, oxides, sulfides, and silicates. However, anthropogenic activities, including industrial emissions, mining, and agricultural practices, significantly increase their prevalence in the ecosystem. These metals can contaminate crops, accumulate in animal tissues via contaminated feed, and ultimately enter the human diet through the consumption of grains, dairy products, meat, and fish. Furthermore, food processing, packaging materials, and industrial waste disposal contribute to heavy metal contamination in food products (Türközü and Şanlıer, 2012). With increasing industrialization, the risk of heavy metal contamination in foods is rising steadily, making these contaminants more prevalent in food products.
Given these concerns, this study aims to evaluate the levels of selected heavy metals and trace elements in chicken meat and liver samples collected from markets operating in Yozgat province, Turkey.
Material and methods
Collection of samples
A total of 21 samples (15 chicken meat and six chicken liver samples) from 15 different brands were collected in May 2021 from 11 randomly selected markets in Yozgat that sell chicken meat and liver. The samples were transported to the Research Laboratory of the Faculty of Medicine at Yozgat Bozok University in compliance with cold chain protocols using sample carrying bags.
Preliminary preparation of samples
The preliminary preparation of the samples was performed by optimizing the method developed by Turksoy et al. (2019) for chicken tissues at the Research Laboratory of the Faculty of Medicine, Yozgat Bozok University (Turksoy et al., 2019). Samples of chicken meat and liver, weighing two g, were placed in polystyrene petri dishes and defrosting in an incubator at 37 °C for 24 h. After defrosting, the samples were weighed, transferred into 50 ml tubes, and treated with five ml of nitric acid (Merck, Germany). Following the addition of nitric acid, the samples were left to stand for at least 20 min before adding two ml of hydrogen peroxide (Merck, Germany). The mixture was then allowed to dissolve completely over 48 h. After dissolution, distilled water was added to bring the total volume to 20 ml. Subsequently, the samples were vortexed for 30 s to achieve a more homogeneous solution. Following this step, the homogenized solution was filtered into 15 ml capped tubes using a Whatman No. 1 filter paper. Finally, the prepared samples were stored at four °C until the day of analysis (Turksoy et al., 2019). Figure 1 presents the preparation procedure of chicken samples for Inductively Coupled Plasma-Mass Spectroscopy (ICP-MS) analyses.
Figure 1: Preparation procedure of chicken samples for Inductively Coupled Plasma-Mass Spectroscopy (ICP-MS) analyses
Determination of heavy metal levels in chicken samples by ICP-MS
Heavy metal levels of 21 samples (15 chicken meat and six chicken liver samples) from different markets were determined in this study. An ICP-MS system (Thermo Scientific, iCAP Qc, USA) was used to measure the concentrations of As, Cu, Zn, Mn, Se, Cr, Hg, Pb, Cd, tin (Sn), Co, Al, Mo, Sb, and Ni in thawed chicken meat and liver samples. The analysis was performed based on the method developed by Turksoy et al. (2019) for heavy metal determination using ICP-MS. Eleven-point calibration curves were generated for each heavy metal, and the results were evaluated based on these curves. Hafnium (Hf) was used as the internal standard.
Statistical analysis
Statistical analyses were performed using the SPSS version 25.0 software. Data were classified into two categories: continuous data and categorical data. Continuous data refer to quantitative measurements, such as heavy metal concentration values, while categorical data represent variables such as sample type (chicken meat and liver). The Kolmogorov-Smirnov test was used to assess the normality of continuous data. Since the data did not conform to a normal distribution, non-parametric tests were used. The Mann-Whitney U test was applied to compare heavy metal levels between chicken meat and liver samples. Spearman correlation analysis was performed to determine relationships between heavy metal concentrations. Descriptive statistics were presented as means, standard deviations, and minimum-maximum values. A p-value <0.05 and 0.01 was considered statistically significant.
Results and discussion
The 15 chicken meat and six chicken liver samples included in the study were analyzed to measure heavy metal concentrations. Table 1 presents the differences in metal concentrations between the chicken meat and liver samples.
Table 1: Comparison of metal concentrations in chicken meat and liver samples
| Heavy Metal (mg/kg) | Mean±SD | Minimum | Maximum | Percentiles | |||
| 25th | 50th (Median) | 75th | |||||
| Meat | Al | 0.254±0.115 | 0.049 | 0.399 | 0.159 | 0.239 | 0.360 |
| Cr | 0.071±0.013 | 0.051 | 0.110 | 0.065 | 0.071 | 0.075 | |
| Mn | 0.056±0.047 | 0.015 | 0.156 | 0.020 | 0.033 | 0.087 | |
| Co | 0.138±0.087 | 0.066 | 0.344 | 0.074 | 0.111 | 0.168 | |
| Ni | 0.088±0.083 | 0.026 | 0.286 | 0.031 | 0.057 | 0.083 | |
| Cu | 0.112±0.023 | 0.069 | 0.164 | 0.100 | 0.109 | 0.130 | |
| Zn | 0.598±0.232 | 0.079 | 0.818 | 0.542 | 0.698 | 0.748 | |
| As | 0.092±0.017 | 0.050 | 0.113 | 0.084 | 0.095 | 0.104 | |
| Se | 0.084±0.019 | 0.046 | 0.125 | 0.072 | 0.085 | 0.089 | |
| Mo | 0.020±0.007 | 0.010 | 0.032 | 0.014 | 0.019 | 0.027 | |
| Cd | 0.061±0.031 | 0.014 | 0.144 | 0.048 | 0.053 | 0.068 | |
| Sn | 0.010±0.003 | 0.006 | 0.015 | 0.007 | 0.010 | 0.013 | |
| Hg* | 0.002±0.004 | 0.015 | |||||
| Sb | 0.020±0.028 | 0.002 | 0.095 | 0.003 | 0.007 | 0.027 | |
| Pb | 0.197±0.111 | 0.038 | 0.386 | 0.110 | 0.186 | 0.304 | |
| Liver | Al | 0.124±0.050 | 0.065 | 0.213 | 0.094 | 0.113 | 0.156 |
| Cr | 0.089±0.010 | 0.073 | 0.100 | 0.079 | 0.091 | 0.098 | |
| Mn | 0.017±0.009 | 0.008 | 0.031 | 0.009 | 0.015 | 0.025 | |
| Co | 0.076±0.024 | 0.052 | 0.117 | 0.059 | 0.069 | 0.096 | |
| Ni | 0.075±0.005 | 0.070 | 0.085 | 0.072 | 0.074 | 0.078 | |
| Cu | 0.118±0.015 | 0.100 | 0.142 | 0.108 | 0.114 | 0.132 | |
| Zn | 0.081±0.053 | 0.005 | 0.145 | 0.033 | 0.086 | 0.129 | |
| As | 0.069±0.008 | 0.058 | 0.078 | 0.062 | 0.071 | 0.077 | |
| Se | 0.106±0.011 | 0.093 | 0.123 | 0.098 | 0.104 | 0.116 | |
| Mo | 0.019±0.002 | 0.017 | 0.023 | 0.018 | 0.019 | 0.020 | |
| Cd | 0.054±0.025 | 0.007 | 0.074 | 0.036 | 0.064 | 0.073 | |
| Sn | 0.002±0.001 | 0.001 | 0.003 | 0.001 | 0.001 | 0.002 | |
| Hg* | |||||||
| Sb | 0.003±0.002 | 0.000 | 0.005 | 0.002 | 0.003 | 0.004 | |
| Pb | 0.221±0.138 | 0.086 | 0.474 | 0.115 | 0.195 | 0.307 | |
*LOD=Limit of Detection. Mercury (Hg) levels in chicken liver samples were below the detection limit (LOD=0.001 mg/kg) and are therefore reported as"
Al: Aluminum, Cr: Chromium, Mn: Manganese, Co: Cobalt, Ni: Nickel, Cu: Copper, Zn: Zinc, As: Arsenic, Se: Selenium, Mo: Molybdenum, Cd: Cadmium, Sn: Tin, Hg: Mercury, Sb: Antimony, Pb: Lead
Al: Aluminum, Cr: Chromium, Mn: Manganese, Co: Cobalt, Ni: Nickel, Cu: Copper, Zn: Zinc, As: Arsenic, Se: Selenium, Mo: Molybdenum, Cd: Cadmium, Sn: Tin, Hg: Mercury, Sb: Antimony, Pb: Lead
As a result of the study, statistically significant differences were observed between chicken meat and liver samples for Cr (p=0.005), Mn (p=0.01), Zn (p=0.002), As (p=0.009), and Sn (p=0.001) levels, all at the p<0.01 significance level. Furthermore, significant differences were identified for Al (p=0.019), Co (p=0.035), and Se (p=0.016) levels between chicken meat and liver, with a significance level of p<0.05. The highest concentration was detected for Zn in chicken meat, while Pb exhibited the highest concentration in liver samples. Conversely, Hg showed the lowest concentration in both sample types. The comparative mean values of heavy metal levels in chicken meat and liver are presented in Figure 2.
Figure 2: Comparison of mean heavy metal levels in chicken meat and liver
According to the results presented in Figure 2, the chicken meat-to-liver ratios of heavy metals were as follows: As (1.33:1), Cu (0.95:1), Zn (7.39:1), Mn (3.29:1), Se (0.79:1), Cr (0.8:1), Hg (2:1), Pb (0.89:1), Cd (1.13:1), Sn (5:1), Co (1.82:1), Al (2.05:1), Mo (1.05:1), Sb (6.67:1), and Ni (1.17:1). Based on these findings, the mean levels of As, Zn, Mn, Hg, Cd, Sn, Co, Al, Sb, and Ni were higher in chicken meat than in chicken liver. Conversely, the mean levels of Se, Cr, and Pb were lower in chicken meat compared to chicken liver. However, no statistically significant differences were observed when samples were grouped according to the place of production, origin regions, or markets (p>0.05).
Table 2 presents the Spearman correlation coefficients between heavy metal concentrations in chicken meat samples. The Spearman correlation analysis was conducted to assess the strength and direction of associations between different heavy metals. The results indicate both positive and negative correlations, with varying degrees of statistical significance (p<0.05 and 0.01). A highly significant positive correlation was observed between Mn and Co (r=0.813, p<0.01), suggesting that these metals may have common sources of contamination, such as feed additives or environmental exposure. Sb and Pb were strongly correlated (r=0.645, p<0.01), indicating a potential co-accumulation mechanism in chicken meat. As and Se (r=0.640, p<0.05) also showed a significant positive correlation, which may be attributed to their similar geochemical behavior in biological systems. Co and Sb (r=0.634, p<0.05) displayed a moderate positive correlation, possibly due to shared environmental contamination sources. Mn and Sb (r=0.651, p<0.01) exhibited a statistically significant relationship, suggesting a potential link between their metabolic pathways in poultry. Cr and Hg (r=-0.550, p<0.05) showed a significant inverse correlation, implying that an increase in one may be associated with a decrease in the other. This could be due to differences in their absorption, bioavailability, or metabolic processing in chicken meat. Cu and Hg (r=-0.639, p<0.05) also demonstrated a significant negative correlation, which may be indicative of competitive interactions at the biochemical level. Several metals, such as Al, Ni, and Zn, did not show strong correlations with other elements, suggesting that their accumulation patterns in chicken meat might be independent of each other. Some weak correlations (e.g., Pb and Zn, Cr and As) were observed but were not statistically significant.
Table 2 presents the Spearman correlation coefficients between heavy metal concentrations in chicken meat samples. The Spearman correlation analysis was conducted to assess the strength and direction of associations between different heavy metals. The results indicate both positive and negative correlations, with varying degrees of statistical significance (p<0.05 and 0.01). A highly significant positive correlation was observed between Mn and Co (r=0.813, p<0.01), suggesting that these metals may have common sources of contamination, such as feed additives or environmental exposure. Sb and Pb were strongly correlated (r=0.645, p<0.01), indicating a potential co-accumulation mechanism in chicken meat. As and Se (r=0.640, p<0.05) also showed a significant positive correlation, which may be attributed to their similar geochemical behavior in biological systems. Co and Sb (r=0.634, p<0.05) displayed a moderate positive correlation, possibly due to shared environmental contamination sources. Mn and Sb (r=0.651, p<0.01) exhibited a statistically significant relationship, suggesting a potential link between their metabolic pathways in poultry. Cr and Hg (r=-0.550, p<0.05) showed a significant inverse correlation, implying that an increase in one may be associated with a decrease in the other. This could be due to differences in their absorption, bioavailability, or metabolic processing in chicken meat. Cu and Hg (r=-0.639, p<0.05) also demonstrated a significant negative correlation, which may be indicative of competitive interactions at the biochemical level. Several metals, such as Al, Ni, and Zn, did not show strong correlations with other elements, suggesting that their accumulation patterns in chicken meat might be independent of each other. Some weak correlations (e.g., Pb and Zn, Cr and As) were observed but were not statistically significant.
Table 2: Spearman correlations of heavy metal levels in chicken meat
| Cr | Mn | Co | Ni | Cu | Zn | As | Se | Mo | Cd | Sn | Hg | Sb | Pb | |
| Al | 0.251 | -0.175 | 0.036 | -0.300 | 0.390 | -0.043 | 0.168 | 0.226 | 0.122 | -0.317 | -0.186 | -0.496 | -0.122 | 0.036 |
| Cr | 1,000 | 0.429 | 0.484 | 0.466 | -0.005 | -0.138 | -0.103 | 0.247 | 0.272 | 0.267 | -0.460 | -0.550* | 0.121 | 0.088 |
| Mn | 1,000 | 0.813** | 0.420 | -0.377 | -0.063 | -0.070 | 0.174 | 0.226 | -0.122 | 0.081 | -0.168 | 0.651** | 0.281 | |
| Co | 1,000 | 0.339 | -0.139 | -0.264 | 0.111 | 0.258 | 0.075 | -0.154 | 0.063 | -0.376 | 0.634* | 0.418 | ||
| Ni | 1,000 | -0.093 | -0.179 | -0.072 | -0.244 | 0.007 | 0.420 | 0.074 | -0.005 | 0.341 | -0.004 | |||
| Cu | 1,000 | 0.114 | 0.108 | 0.269 | -0.084 | -0.085 | -0.009 | -0.639* | -0.419 | -0.336 | ||||
| Zn | 1,000 | -0.240 | 0.143 | 0.077 | 0.004 | 0.366 | -0.102 | -0.104 | -0.161 | |||||
| As | 1,000 | 0.640* | -0.267 | 0.205 | -0.184 | 0.118 | 0.195 | 0.437 | ||||||
| Se | 1,000 | -0.177 | 0.038 | -0.365 | -0.390 | 0.142 | 0.473 | |||||||
| Mo | 1,000 | 0.313 | 0.005 | -0.303 | 0.014 | -0.492 | ||||||||
| Cd | 1,000 | -0.146 | 0.126 | 0.066 | -0.104 | |||||||||
| Sn | 1,000 | 0.106 | 0.092 | -0.070 | ||||||||||
| Hg | 1,000 | 0.141 | 0.123 | |||||||||||
| Sb | 1,000 | 0.645** | ||||||||||||
| Pb | 1,000 |
* Correlation is significant at the 0.05 level (p<0.05)
** Correlation is significant at the 0.01 level (p<0.01)
Al: Aluminum, Cr: Chromium, Mn: Manganese, Co: Cobalt, Ni: Nickel, Cu: Copper, Zn: Zinc, As: Arsenic, Se: Selenium, Mo: Molybdenum, Cd: Cadmium, Sn: Tin, Hg: Mercury, Sb: Antimony, Pb: Lead
** Correlation is significant at the 0.01 level (p<0.01)
Al: Aluminum, Cr: Chromium, Mn: Manganese, Co: Cobalt, Ni: Nickel, Cu: Copper, Zn: Zinc, As: Arsenic, Se: Selenium, Mo: Molybdenum, Cd: Cadmium, Sn: Tin, Hg: Mercury, Sb: Antimony, Pb: Lead
Table 3 presents the Spearman correlation coefficients for heavy metal concentrations in chicken liver samples. This analysis provides insight into the relationships between different heavy metals, indicating possible shared contamination sources, metabolic interactions, or antagonistic effects. The results reveal both positive and negative correlations, with varying degrees of statistical significance (p<0.05 and 0.01). A highly significant positive correlation was observed between Cr and Ni (r=0.928, p<0.01), indicating that these elements may share similar environmental or dietary contamination sources such as industrial pollutants or contaminated feed. Additionally, As and Se (r=0.927, p<0.01) exhibited a strong correlation, which could be attributed to their geochemical similarities and their interactions in biological systems. Significant positive correlations were also detected between Al and Ni (r=0.868, p<0.05), Al and Cr (r=0.841, p<0.05), and Al and Pb (r=0.842, p<0.05), suggesting that Al contamination may be associated with the bioaccumulation of heavy metals in poultry liver. A moderate positive correlation was observed between Mn and Co (r=0.829, p<0.05), which could indicate a shared contamination pathway, potentially from poultry feed additives or environmental exposure. Furthermore, a highly significant correlation was found between Cu and Zn (r=0.943, p<0.01), reflecting their essential roles in biological processes and their tendency to co-exist in animal tissues. The correlation between Ni and Pb (r=0.754, p<0.05) suggests a possible common contamination source, likely linked to industrial emissions or agricultural inputs. In contrast, strong negative correlations were identified, particularly between Al and Se (r=-0.956, p<0.01) and Al and As (r=-0.899, p<0.05), implying that Al exposure may influence the bioavailability or accumulation of these elements in chicken liver. Similarly, Ni and As (r=-0.812, p<0.05) displayed an inverse relationship, possibly due to competitive absorption mechanisms within biological systems. The correlation between Se and Pb (r=-0.841, p<0.05) suggests an antagonistic interaction, where an increase in one metal may result in a decrease in the other. Several metals, including Cd, Sn, and Sb, did not exhibit significant correlations with other elements, indicating that their accumulation patterns in chicken liver may be independent. Additionally, weak correlations, such as those between Pb and Zn, and Cr and As, were observed but were not statistically significant. These findings highlight the complexity of heavy metal interactions in poultry liver and underscore the need for further research into their metabolic pathways and environmental sources.
Table 3: Spearman correlations of heavy metal levels in chicken liver
| Cr | Mn | Co | Ni | Cu | Zn | As | Se | Mo | Cd | Sn | Sb | Pb | |
| Al | 0.841* | 0.261 | 0.406 | 0.868* | -0.087 | -0.377 | -0.899* | -0.956** | 0.154 | 0.058 | 0.429 | -0.092 | 0.842* |
| Cr | 1,000 | 0.314 | 0.371 | 0.928** | -0.086 | -0.257 | -0.714 | -0.696 | 0.030 | 0.314 | -0.068 | 0.213 | 0.600 |
| Mn | 1,000 | 0.829* | 0.522 | 0.600 | 0.543 | -0.257 | -0.058 | 0.759 | 0.200 | -0.068 | -0.516 | 0.486 | |
| Co | 1,000 | 0.580 | 0.086 | 0.029 | -0.600 | -0.319 | 0.455 | 0.486 | 0.101 | -0.334 | 0.771 | ||
| Ni | 1,000 | 0.000 | -0.203 | -0.812* | -0.735 | 0.339 | 0.406 | 0.171 | 0.092 | 0.754 | |||
| Cu | 1,000 | 0.943** | 0.371 | 0.290 | 0.698 | -0.543 | -0.135 | -0.698 | -0.143 | ||||
| Zn | 1,000 | 0.600 | 0.580 | 0.577 | -0.429 | -0.372 | -0.577 | -0.371 | |||||
| As | 1,000 | 0.927** | -0.091 | -0.371 | -0.507 | -0.030 | -0.943** | ||||||
| Se | 1,000 | -0.031 | -0.058 | -0.600 | 0.031 | -0.841* | |||||||
| Mo | 1,000 | -0.030 | 0.359 | -0.484 | 0.273 | ||||||||
| Cd | 1,000 | -0.135 | 0.638 | 0.257 | |||||||||
| Sn | 1,000 | -0.216 | 0.507 | ||||||||||
| Sb | 1,000 | -0.273 | |||||||||||
| Pb | 1,000 |
* Correlation is significant at the 0.05 level (p<0.05).
** Correlation is significant at the 0.01 level (p<0.01).
Mercury (Hg) levels were excluded because they were below the Limit of Detection (LOD)
Al: Aluminum, Cr: Chromium, Mn: Manganese, Co: Cobalt, Ni: Nickel, Cu: Copper, Zn: Zinc, As: Arsenic, Se: Selenium, Mo: Molybdenum, Cd: Cadmium, Sn: Tin, Hg: Mercury, Sb: Antimony, Pb: Lead
The observed correlations indicate that certain heavy metals may originate from common environmental or dietary sources, including contaminated feed, water, soil, and industrial emissions. The strong positive correlations among Mn, Co, Sb, and Pb suggest that these elements share similar contamination pathways, likely stemming from industrial pollutants, agricultural fertilizers, or feed additives used in poultry farming. These metals can accumulate in animal tissues through prolonged exposure to contaminated water sources or ingestion of feed ingredients containing trace amounts of heavy metals. Conversely, the significant negative correlations, particularly those involving Hg, may reflect differences in bioavailability, metabolic processing, or competitive absorption mechanisms in poultry tissues. The inverse relationships between Cr and Hg, as well as Cu and Hg, suggest potential antagonistic interactions, where the presence of one metal may inhibit the uptake or accumulation of the other. Such interactions could be influenced by physiological factors, including metal-binding affinities to proteins, competitive inhibition during absorption, or variations in excretion rates. The strong correlations among toxic metals such as Pb, As, and Hg raise serious food safety concerns, as their co-occurrence in poultry products increases the risk of cumulative dietary exposure in humans. Chronic intake of heavy metals through contaminated food has been associated with various adverse health effects, including neurotoxicity, carcinogenicity, and organ damage. These findings emphasize the critical need for rigorous monitoring and regulation of heavy metal contamination in poultry products to mitigate public health risks. Implementing strict quality control measures in poultry feed production, enhancing environmental pollutant surveillance, and enforcing regulatory limits on heavy metal residues in food are essential steps in reducing the potential for dietary exposure to toxic metals. The correlation analysis provides valuable insights into the interrelationships among heavy metals in chicken liver, revealing both common contamination pathways and potential metal-metal interactions influencing bioaccumulation. These findings underscore the necessity for stricter regulatory controls on poultry feed quality, environmental pollutant monitoring, and food safety assessments to minimize heavy metal exposure through poultry consumption. Future studies should focus on elucidating the mechanistic basis of these correlations, exploring their implications for metal toxicity, metabolism, and long-term health risks in humans.
The mean values and permissible limits of heavy metal levels in chicken meat and liver samples are presented in Table 4. The analysis reveals that Pb and Cd levels in chicken meat exceed the permissible limits established by both World Health Organization (WHO) (0.1 mg/kg for Pb, 0.05 mg/kg for Cd) and Turkish Food Codex Contaminants Regulation (TFCCR) (0.1 mg/kg for Pb, 0.05 mg/kg for Cd), indicating potential food safety concerns (Moroğlu Arseven, 2023; WHO, 1996). However, the Pb and Cd concentrations in chicken liver remain within the allowable thresholds. Most other heavy metals, including Al, Cr, Mn, Co, Ni, Cu, Zn, As, Se, Mo, Sn, Hg, and Sb were detected at levels below the established regulatory limits, suggesting that their presence in chicken meat and liver does not pose an immediate health risk based on current safety guidelines (FAO/WHO,2002; JECFA, 2011; WHO, 1996). The findings highlight the need for continuous monitoring and stricter regulation of Pb and Cd contamination in poultry products to minimize potential health risks associated with heavy metal exposure through consumption.
The mean values and permissible limits of heavy metal levels in chicken meat and liver samples are presented in Table 4. The analysis reveals that Pb and Cd levels in chicken meat exceed the permissible limits established by both World Health Organization (WHO) (0.1 mg/kg for Pb, 0.05 mg/kg for Cd) and Turkish Food Codex Contaminants Regulation (TFCCR) (0.1 mg/kg for Pb, 0.05 mg/kg for Cd), indicating potential food safety concerns (Moroğlu Arseven, 2023; WHO, 1996). However, the Pb and Cd concentrations in chicken liver remain within the allowable thresholds. Most other heavy metals, including Al, Cr, Mn, Co, Ni, Cu, Zn, As, Se, Mo, Sn, Hg, and Sb were detected at levels below the established regulatory limits, suggesting that their presence in chicken meat and liver does not pose an immediate health risk based on current safety guidelines (FAO/WHO,2002; JECFA, 2011; WHO, 1996). The findings highlight the need for continuous monitoring and stricter regulation of Pb and Cd contamination in poultry products to minimize potential health risks associated with heavy metal exposure through consumption.
Table 4: Mean values and permissible limits of heavy metal levels in chicken meat and liver samples according to two standards
| Heavy metal (mg/kg) |
Mean concentration in chicken meat |
Mean concentration in chicken liver |
Permissible limits (international standards) |
WHO permissible limit |
TFCCR (Moroğlu Arseven, 2023) |
|
| Mean chicken meat |
Mean chicken liver |
|||||
| Al | 0.254 | 0.124 | 1.0 (JECFA, 2011) | - | - | - |
| Cr | 0.071 | 0.089 | 1.0 (FAO/WHO, 2002) | 1.0 | - | - |
| Mn | 0.056 | 0.017 | 0.5 (Joint FAO/WHO Codex Alimentarius Commission, 2000) |
- | - | - |
| Co | 0.138 | 0.076 | - | 1.0 | - | - |
| Ni | 0.088 | 0.075 | 0.5 (JECFA, 2005) | 0.5 | - | - |
| Cu | 0.112 | 0.118 | 1.0 (FAO/WHO, 2002) | 0.4 | - | - |
| Zn | 0.598 | 0.081 | 20.0 (FAO/WHO, 2002; Roychowdhury et al., 2003) |
50.0 | - | - |
| As | 0.092 | 0.069 | 0.1 (JECFA, 2005) | 0.5 | - | - |
| Se | 0.084 | 0.106 | - | - | - | - |
| Mo | 0.020 | 0.019 | - | - | - | - |
| Cd | 0.061 | 0.054 | 0.05 (FAO/WHO, 2002) | 0.3 | 0.05 | 0.5 |
| Sn | 0.010 | 0.002 | - | - | - | - |
| Hg* | 0.002 | 0.001 | - | 0.1 | - | - |
| Sb | 0.020 | 0.003 | - | - | - | - |
| Pb | 0.197 | 0.221 | 0.1 (FAO/WHO, 2002) | 0.1 | 0.1 | 0.5 |
TFCCR=Turkish Food Codex Contaminants Regulation; WHO=World Health Organization
Al: Aluminum, Cr: Chromium, Mn: Manganese, Co: Cobalt, Ni: Nickel, Cu: Copper, Zn: Zinc, As: Arsenic, Se: Selenium, Mo: Molybdenum, Cd: Cadmium, Sn: Tin, Hg: Mercury, Sb: Antimony, Pb: Lead
Al: Aluminum, Cr: Chromium, Mn: Manganese, Co: Cobalt, Ni: Nickel, Cu: Copper, Zn: Zinc, As: Arsenic, Se: Selenium, Mo: Molybdenum, Cd: Cadmium, Sn: Tin, Hg: Mercury, Sb: Antimony, Pb: Lead
Heavy metals are of particular concern due to their persistence in the environment, bioaccumulative nature, and widespread distribution. Türközü and Şanlıer (2012) emphasized the significance of heavy metals as chemical contaminants, highlighting their ability to enter the food chain through industrial emissions, agricultural runoff, contaminated water sources, and feed additives. Their resistance to environmental degradation allows them to accumulate in biological systems, posing potential risks to food safety and human health (Türközü and Şanlıer, 2012). In line with these findings, our study confirms the presence of heavy metals in chicken meat and liver, particularly with Pb and Cd exceeding permissible limits. This underscores the need for stricter regulatory enforcement to monitor contamination sources, control feed quality, and mitigate human exposure risks. Further research is needed to assess regional contamination variations, long-term bioaccumulation trends, and develop effective mitigation strategies to reduce heavy metal exposure in poultry products.
Hira and Yörük (2015) conducted a study to determine the effects of using inorganic and organic Cu, Zn, and Mn in laying hen diets at the levels recommended by the National Research Council (NRC) and at 66 and 33% of these levels on performance and egg quality. They reported that traditional inorganic trace mineral supplementation in laying hen diets exceeds the required levels and can be reduced without adversely affecting performance or egg quality (Hira and Yörük, 2015). In our study, although egg samples were not analyzed, the concentrations of Cu, Zn, and Mn in chicken meat (0.112, 0.598, and 0.056 mg/kg, respectively) and chicken liver (0.118, 0.081, and 0.017 mg/kg, respectively) were found to be within internationally permissible limits (FAO/WHO, 2002). These findings are in agreement with the results of Hira and Yörük (2015), as our study also suggests that the levels of these essential trace elements in chicken tissues do not exceed safety thresholds.
Göçmen and Cufadar (2012) reported that the addition of Cr to poultry rations enhances live weight gain, feed consumption, and feed utilization rate, improves carcass characteristics, and may help reduce stress in poultry. Similarly, Attia et al. (2019) emphasized that trace elements like Cr play a crucial role in poultry metabolism and stress regulation, particularly under environmental stress conditions. In our study, Cr concentrations in chicken meat (0.071 mg/kg) and liver (0.089 mg/kg) were found to be within the internationally permissible limit of 1.0 mg/kg (FAO/WHO, 2002). These findings align with previous research indicating that Cr levels in poultry tissues generally remain within safe limits when included in feed formulations at appropriate concentrations. The similarity in findings can be attributed to strict regulations on poultry feed composition and controlled Cr supplementation in diets. However, deviations may occur depending on feed quality, environmental exposure, and regional differences in agricultural practices.
As contamination in poultry has been widely studied due to its toxicity and potential carcinogenic effects. Yildirim et al. (2016) reported As levels in chicken meat (0.081±0.035 mg/kg) and internal organs (0.055±0.012 mg/kg) in Kayseri, Turkey, demonstrating the presence of As contamination in poultry products. Our findings are consistent with this study, showing As concentrations in chicken meat (0.092 mg/kg) and liver (0.069 mg/kg) within the permissible limit of 0.1 mg/kg (JECFA, 2005). However, continuous monitoring is essential, since As contamination can vary depending on water sources, soil composition, and feed additives used in poultry farming.
A comparative study conducted in Iraq by Ali et al. (2020) reported heavy metal concentrations in poultry meat, revealing that Cu (2.05 mg/kg), Hg (0.11 mg/kg), and Pb (0.28 mg/kg) significantly exceeded WHO permissible limits. In our study, Pb levels in chicken meat (0.197 mg/kg) exceeded the WHO limit (0.1 mg/kg), while Cd levels (0.061 mg/kg) surpassed the TFCCR limit as well (0.05 mg/kg). These findings suggest that Pb and Cd contamination in poultry may be influenced by environmental factors, feed quality, and industrial activities in different regions. The elevated levels observed in our study emphasize the need for strict monitoring programs to control contamination sources and prevent excessive heavy metal accumulation in poultry products.
Yerli et al. (2020) stated that with increasing industrialization and urbanization, various forms of environmental pollution have intensified, leading to numerous environmental issues, with heavy metals being among the most significant. They provided information on the sources of heavy metals, their effects on soil and water as well as plant physiology, the relationship between soil properties and heavy metals, , the defense, and tolerance mechanisms of plants against heavy metals, and the effects of heavy metals on human health (Yerli et al., 2020). The elevated Pb and Cd levels in chicken tissues observed in this study may be attributed to environmental and feed contamination. In line with the aforementioned studies, the mean heavy metal levels in chicken meat were higher than those in chicken liver. Specifically, the mean concentrations of As, Zn, Mn, Hg, Cd, Sn, Co, Al, Sb, and Ni were higher in chicken meat, while the mean levels of Se, Cr, and Pb were lower compared to those in chicken liver.
Conclusion
This study aimed to underscore food safety concerns by examining the heavy metal levels in chicken meat and liver samples sourced from local markets. The main limitation of this study was the limited sample size (n=21), which may not fully represent all market products in the region. Additionally, seasonal variations and different production methods were not considered, which could influence heavy metal accumulation. Therefore, future research should include a larger sample size across various regions and seasons to assess broader contamination trends. Examining a broader range of poultry products and exploring potential contamination sources, such as feed and environmental factors, would provide more comprehensive insights. Longitudinal studies evaluating changes over time are also recommended.
This study provides valuable insights for consumers and local authorities, emphasizing the need for stricter monitoring of heavy metal contamination in poultry. The findings can guide food safety policies, influence consumer decisions, and assist local officials in implement preventive measures to mitigate environmental contamination sources that impact food quality.
Author contributions
S.Ş. and İ.G. designed and conducted the study; V.A.T. reviewed the manuscript; İ.G. and S.Ş. performed data analysis and contributed to writing the manuscript. All authors read and approved the final version of the manuscript.
Funding
This research received no external funding.
Ethical consideration
Not applicable.
Conflicts of Interest
The authors declare no conflicts of interest.
References
Agency for Toxic Substances and Disease Registry (ATSDR). (2019). Toxicological profile for antimony and compounds. URL: https://www.atsdr.cdc.gov/ toxprofiles/tp23.pdf. Accessed 6 November 2021.
Ali H.S., Almashhadany D.A., Khalid H.S. (2020). Determination of heavy metals and selenium content in chicken liver at Erbil city, Iraq. Italian Journal of Food Safety. 9: 8659. [DOI: 10.4081/ıjfs.2020.8659]
Aschner M., Erikson K.M., Hernández E.H., Tjalkens R. (2009). manganese and its role in parkinson’s disease: from transport to neuropathology. NeuroMolecular Medicine. 11: 252-266. [DOI: 10.1007/s12017-009-8083-0]
Attia Y.A., Addeo N.F., Abd Al-Hamid A.A.-H.E., Bovera F. (2019). Effects of phytase supplementation to diets with or without zinc addition on growth performance and zinc utilization of white pekin ducks. Animals. 9: 280. [DOI: 10.3390/ani9050280]
Food and Agriculture Organization/World Health Organization (FAO/WHO). (2002). Report Of The 34th Sessıon Of The Codex Commıttee On Food Addıtıves And Contamınants. URL: https://www.maff. go.jp/ j/syouan/ nouan/kome/k_cd/ 04_kijyun/attach/ pdf/ 01_int-22.pdf. Accessed 1 March 2022.
Fortin N.D. (2023). Global governance of food safety: the role of the FAO, WHO, and Codex Alimentarius in regulatory harmonization. In: Roberts M.T. (Editor). Research handbook on ınternational food law. Edward Elgar Publishing, Cheltenham, United Kingdom. pp: 227-242. [DOI: 10.4337/ 9781800374676.00024]
Göçmen R., Cufadar Y. (2012). The role of chrome in poultry nutrition. Journal of Poultry Research. 9: 11-14. [Turkish with English abstract]
Hira F., Yörük M.A. (2015). The effect of different levels of inorganic and organic copper, zinc and manganase on egg production and quality in laying hens. Atatürk University Journal of Veterinary Sciences. 10:77-87. [DOI: 10.17094/avbd.01827]. [Turkish with English abstract]
Ilyasu U.S., Tauheed F.L., Bala J.D., Nnaji M. (2024). International regulations in food contaminants. In: Aransiola S.A., Akinsola R.O., Abioye O.P., Maddela N.R. (Editors). Emerging contaminants in food and food products. 1st edition. CRC Press, Boca Raton, Florida, United States. pp: 29-43. [DOI: 10.1201/ 9781003438236]
Joint FAO/WHO Codex Alimentarius Commission. (2000). Joint FAO/WHO food standards programme, codex alimentarius commission, twenty-fourth session, Geneva, Switzerland, 2-7 July 2001: report of the 32nd session of the codex committee on food additives and contaminants, Beijing, People's Republic of China, 20-24 March 2000. Food and Agriculture Organization of the United Nations.
Joint FAO/WHO Expert Committee on Food Additives (JECFA). (2005). Summary and conclusions of the sixty-fourth meeting of the Joint FAO/WHO Expert Committee on Food Additives (JECFA). Rome, Italy. URL: https://www.fao.org/3/ at877e/at877e.pdf. Accessed 13 September 2021.
Joint FAO/WHO Expert Committee on Food Additives (JECFA). (2011). Summary report of the seventy-fourth meeting of JECFA. Rome, Italy. URL: https://www.fao.org/3/at873e/at873e. pdf. Accessed 13 December 2021.
Moroğlu Arseven. (2023). The Turkish food codex regulation on contaminants entered into force. URL: https://www. morogluarseven.com/news-and-publications/the-turkish-food-codex-regulation-on-contaminants-entered-into-force/. Accessed 9 March 2025.
Roychowdhury T., Tokunaga H., Ando M. (2003). Survey of arsenic and other heavy metals in food composites and drinking water and estimation of dietary intake by the villagers from an arsenic-affected area of West Bengal, India. The Science of the Total Environment. 308: 15-35. [DOI: 10.1016/S0048-9697(02)00612-5]
Şahin S., Azarkan S.Y., Türksoy V.A. (2024). Evaluation of the effect of cannabidiol on the THLE-2 liver cell line exposed to lead. Science of the Total Environment. 923: 170901. [DOI: 10.1016/J.SCITOTENV.2024. 170901]
Sahin S., Mortas T., Muderrisoglu A., Turksoy V.A. (2025). Investigation of cannabidiol’s protective effects on cadmium-induced toxicity in mice. Basic and Clinical Pharmacology and Toxicology. 136: e14131. [DOI: 10.1111/BCPT.14131]
Sipahi H., Palabıyık Ş.S., Balcı S., Şahin G. (2015). Aluminum toxicity and its role in neurodegenerative diseases: review. Turkiye Klinikleri Journal of Neurology. 10: 6-14. [DOI: 10.5336/neuro.2014-41039]. [Turkish with English abstract]
Turksoy V.A., Tutkun L., Gunduzoz M., Oztan O., Deniz S., Iritas S.B. (2019). Changing levels of selenium and zinc in cadmium-exposed workers: probable association with the intensity of inflammation. Molecular Biology Reports. 46: 5455-5464. [DOI: 10.1007/s11033-019-05001-4]
Turksoy V.A., Yalvac E.S., Simsek O.T., Aziz V., Kocoglus S., Tutkun E., Singh B. (2019). Impact of zinc on birth and placental weight in cadmium and lead exposure during pregnancy. Indian Journal of Forensic Medicine and Pathology. 12: 246-254. [DOI: 10.21088/ijfmp.0974.3383.12319.15]
Türközü D., Şanlıer N. (2012). Current overview: heavy metal contamination of food. Selcuk Journal of Agriculture and Food Sciences. 26: 73-80. [Turkish with English abstract]
World Health Organization (WHO). (1996). Trace elements in human nutrition and health. Report of a WHO Expert Comrntttee, Geneva URL: https:// apps.who.int/iris/bitstream/handle/ 10665/37931/9241561734_eng.pdf?sequence=2&isAllowed=y. Accessed 30 December 2021.
Yerli C., Çakmakcı T., Sahi̇n U., Tüfenkçi S. (2020). The effects of heavy metals on soil, plant, water and human health. Turkish Journal of Nature and Science. 9: 103-114. [DOI: 10.46810/tdfd.718449]. [Turkish with English abstract]
Yildirim Y., Gönülalan Z., Onmaz N.E., Hizlisoy H., AL S., Pamuk Ş. (2016). Arsenic levels in chicken meat and giblets retailed in Kayseri. Journal of Faculty of Veterinary Medicine, Erciyes University. 13: 209-214. [Turkish with English abstract]
* Corresponding author (S. Şahin)
* E-mail: serkan.sahin@bozok.edu.tr
ORCID ID: https://orcid.org/0000-0001-7000-6342
* E-mail: serkan.sahin@bozok.edu.tr
ORCID ID: https://orcid.org/0000-0001-7000-6342
Type of Study: Original article |
Subject:
Special
Received: 24/07/20 | Accepted: 25/01/27 | Published: 25/03/30
Received: 24/07/20 | Accepted: 25/01/27 | Published: 25/03/30
References
1. Agency for Toxic Substances and Disease Registry (ATSDR). (2019). Toxicological profile for antimony and compounds. URL: https://www.atsdr.cdc.gov/ toxprofiles/tp23.pdf. Accessed 6 November 2021.
2. Ali H.S., Almashhadany D.A., Khalid H.S. (2020). Determination of heavy metals and selenium content in chicken liver at Erbil city, Iraq. Italian Journal of Food Safety. 9: 8659. [DOI: 10.4081/ıjfs.2020.8659] [DOI:10.4081/ijfs.2020.8659]
3. Aschner M., Erikson K.M., Hernández E.H., Tjalkens R. (2009). manganese and its role in parkinson's disease: from transport to neuropathology. NeuroMolecular Medicine. 11: 252-266. [DOI: 10.1007/s12017-009-8083-0] [DOI:10.1007/s12017-009-8083-0] [PMID] [PMCID]
4. Attia Y.A., Addeo N.F., Abd Al-Hamid A.A.-H.E., Bovera F. (2019). Effects of phytase supplementation to diets with or without zinc addition on growth performance and zinc utilization of white pekin ducks. Animals. 9: 280. [DOI: 10.3390/ani9050280] [DOI:10.3390/ani9050280] [PMID] [PMCID]
5. Food and Agriculture Organization/World Health Organization (FAO/WHO). (2002). Report Of The 34th Sessıon Of The Codex Commıttee On Food Addıtıves And Contamınants. URL: https://www.maff. go.jp/ j/syouan/ nouan/kome/k_cd/ 04_kijyun/attach/ pdf/ 01_int-22.pdf. Accessed 1 March 2022.
6. Fortin N.D. (2023). Global governance of food safety: the role of the FAO, WHO, and Codex Alimentarius in regulatory harmonization. In: Roberts M.T. (Editor). Research handbook on ınternational food law. Edward Elgar Publishing, Cheltenham, United Kingdom. pp: 227-242. [DOI: 10.4337/ 9781800374676.00024] [DOI:10.4337/9781800374676.00024]
7. Göçmen R., Cufadar Y. (2012). The role of chrome in poultry nutrition. Journal of Poultry Research. 9: 11-14. [Turkish with English abstract]
8. Hira F., Yörük M.A. (2015). The effect of different levels of inorganic and organic copper, zinc and manganase on egg production and quality in laying hens. Atatürk University Journal of Veterinary Sciences. 10:77-87. [DOI: 10.17094/avbd.01827]. [Turkish with English abstract] [DOI:10.17094/avbd.01827]
9. Ilyasu U.S., Tauheed F.L., Bala J.D., Nnaji M. (2024). International regulations in food contaminants. In: Aransiola S.A., Akinsola R.O., Abioye O.P., Maddela N.R. (Editors). Emerging contaminants in food and food products. 1st edition. CRC Press, Boca Raton, Florida, United States. pp: 29-43. [DOI: 10.1201/ 9781003438236]
10. Joint FAO/WHO Codex Alimentarius Commission. (2000). Joint FAO/WHO food standards programme, codex alimentarius commission, twenty-fourth session, Geneva, Switzerland, 2-7 July 2001: report of the 32nd session of the codex committee on food additives and contaminants, Beijing, People's Republic of China, 20-24 March 2000. Food and Agriculture Organization of the United Nations.
11. Joint FAO/WHO Expert Committee on Food Additives (JECFA). (2005). Summary and conclusions of the sixty-fourth meeting of the Joint FAO/WHO Expert Committee on Food Additives (JECFA). Rome, Italy. URL: https://www.fao.org/3/ at877e/at877e.pdf. Accessed 13 September 2021.
12. Joint FAO/WHO Expert Committee on Food Additives (JECFA). (2011). Summary report of the seventy-fourth meeting of JECFA. Rome, Italy. URL: https://www.fao.org/3/at873e/at873e. pdf. Accessed 13 December 2021.
13. Moroğlu Arseven. (2023). The Turkish food codex regulation on contaminants entered into force. URL: https://www. morogluarseven.com/news-and-publications/the-turkish-food-codex-regulation-on-contaminants-entered-into-force/. Accessed 9 March 2025.
14. Roychowdhury T., Tokunaga H., Ando M. (2003). Survey of arsenic and other heavy metals in food composites and drinking water and estimation of dietary intake by the villagers from an arsenic-affected area of West Bengal, India. The Science of the Total Environment. 308: 15-35. [DOI: 10.1016/S0048-9697(02)00612-5] [DOI:10.1016/S0048-9697(02)00612-5] [PMID]
15. Şahin S., Azarkan S.Y., Türksoy V.A. (2024). Evaluation of the effect of cannabidiol on the THLE-2 liver cell line exposed to lead. Science of the Total Environment. 923: 170901. [DOI: 10.1016/J.SCITOTENV.2024. 170901] [DOI:10.1016/j.scitotenv.2024.170901] [PMID]
16. Sahin S., Mortas T., Muderrisoglu A., Turksoy V.A. (2025). Investigation of cannabidiol's protective effects on cadmium-induced toxicity in mice. Basic and Clinical Pharmacology and Toxicology. 136: e14131. [DOI: 10.1111/BCPT.14131] [DOI:10.1111/bcpt.14131] [PMID] [PMCID]
17. Sipahi H., Palabıyık Ş.S., Balcı S., Şahin G. (2015). Aluminum toxicity and its role in neurodegenerative diseases: review. Turkiye Klinikleri Journal of Neurology. 10: 6-14. [DOI: 10.5336/neuro.2014-41039]. [Turkish with English abstract] [DOI:10.5336/neuro.2014-41039]
18. Turksoy V.A., Tutkun L., Gunduzoz M., Oztan O., Deniz S., Iritas S.B. (2019). Changing levels of selenium and zinc in cadmium-exposed workers: probable association with the intensity of inflammation. Molecular Biology Reports. 46: 5455-5464. [DOI: 10.1007/s11033-019-05001-4] [DOI:10.1007/s11033-019-05001-4] [PMID]
19. Turksoy V.A., Yalvac E.S., Simsek O.T., Aziz V., Kocoglus S., Tutkun E., Singh B. (2019). Impact of zinc on birth and placental weight in cadmium and lead exposure during pregnancy. Indian Journal of Forensic Medicine and Pathology. 12: 246-254. [DOI: 10.21088/ijfmp.0974.3383.12319.15] [DOI:10.21088/ijfmp.0974.3383.12319.15]
20. Türközü D., Şanlıer N. (2012). Current overview: heavy metal contamination of food. Selcuk Journal of Agriculture and Food Sciences. 26: 73-80. [Turkish with English abstract]
21. World Health Organization (WHO). (1996). Trace elements in human nutrition and health. Report of a WHO Expert Comrntttee, Geneva URL: https:// apps.who.int/iris/bitstream/handle/ 10665/37931/9241561734_eng.pdf?sequence=2&isAllowed=y. Accessed 30 December 2021.
22. Yerli C., Çakmakcı T., Sahi̇n U., Tüfenkçi S. (2020). The effects of heavy metals on soil, plant, water and human health. Turkish Journal of Nature and Science. 9: 103-114. [DOI: 10.46810/tdfd.718449]. [Turkish with English abstract] [DOI:10.46810/tdfd.718449]
23. Yildirim Y., Gönülalan Z., Onmaz N.E., Hizlisoy H., AL S., Pamuk Ş. (2016). Arsenic levels in chicken meat and giblets retailed in Kayseri. Journal of Faculty of Veterinary Medicine, Erciyes University. 13: 209-214. [Turkish with English abstract]
| Rights and permissions | |
 |
This work is licensed under a Creative Commons Attribution-NonCommercial 4.0 International License. |
