

Volume 11, Issue 2 (June 2024)
J. Food Qual. Hazards Control 2024, 11(2): 135-148 |
Back to browse issues page


Ethics code: 0000
Download citation:
BibTeX | RIS | EndNote | Medlars | ProCite | Reference Manager | RefWorks
Send citation to:


BibTeX | RIS | EndNote | Medlars | ProCite | Reference Manager | RefWorks
Send citation to:
Iwe M, Anya P, Ubbor S, Agiriga A, Okoro C. Modelling the Color and Microbial Properties of Canned Ngu by Response Surface Method. J. Food Qual. Hazards Control 2024; 11 (2) :135-148
URL: http://jfqhc.ssu.ac.ir/article-1-1116-en.html
URL: http://jfqhc.ssu.ac.ir/article-1-1116-en.html


Department of Food Science and Technology, Federal University Oye-Ekiti, Nigeria , favoured4sure@gmail.com
Full-Text [PDF 1766 kb]
(647 Downloads)
| Abstract (HTML) (1262 Views)
Full-Text: (99 Views)
Modelling the Color and Microbial Properties of Canned Ngu by Response Surface Method
M.O. Iwe 1, P.C. Anya 1, S..Ubbor 1, A.N..Agiriga 2*, C..Okoro 1
1. Department of Food Science and Technology, Michael Okpara University of Agriculture, Umudike, Nigeria
2. Department of Food Science and Technology, Federal University Oye-Ekiti, Nigeria
HIGHLIGHTS:
 (1)
(1)
Where, Y=dependent variable
X i  and
and X j  =independent variables
K=number of independent variables
β 0
ε  =random error terms
Thirty-two experimental runs were generated based on CCD to study the interactions between factors in addition to identifying significant factors. The three factors considered in this experiment were: type of stabilizer, concentration of stabilizer, and sterilization time. The center point (0, 0, 0) with Akparatta as the stabilizer, 0.63 stabilizer concentration and 15 min sterilization time was replicated five times (Kiwu-Lawrence et al., 2021). The independent variables and levels for the production of canned Ngu are illustrated in Table 1 and the experimental design variable settings for the production of canned Ngu are demonstrated in Table 2.
Table 1: Independent variables and levels for production of canned Ngu
CMC=Carboxyl Methyl Cellulose
Table 2: Experimental design for the production of canned Ngu
CMC=Carboxyl Methyl Cellulose
Table 3: Color properties of canned Ngu
L* represents clarity (L=0 black, and L*=100 colorless)
a* (green/red color component (a*>0 red, a*<0 green)
b* (blue/yellow (b*> 0 yellow, b*<0 blue)
CMC=Carboxyl Methyl Cellulose
Table 4: Microbial properties of canned Ngu
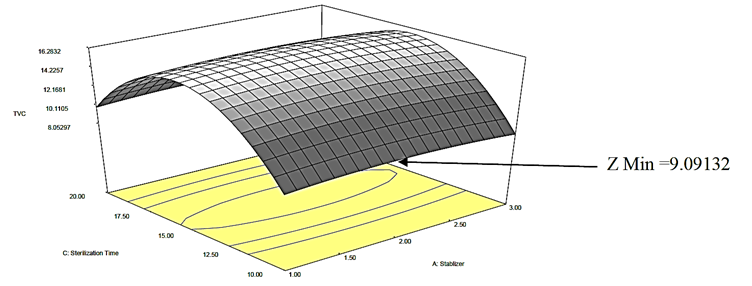
Figure 1: Response surface plot for the effect of sterilization time and stabilizer on Total Viable Count (TVC) of canned Ngu
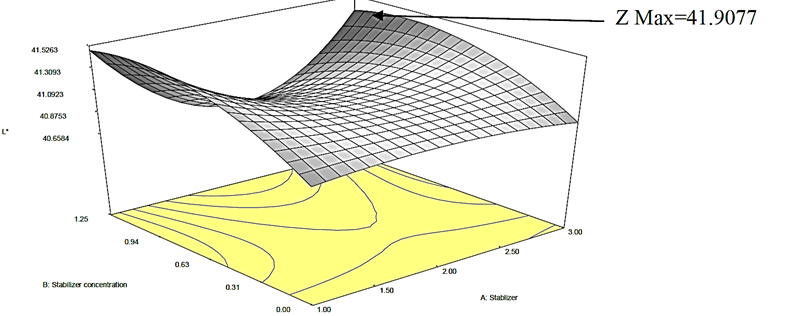
Figure 2a: Response surface plot for the effect of stabilizer concentration and stabilizer on the L* value of canned Ngu
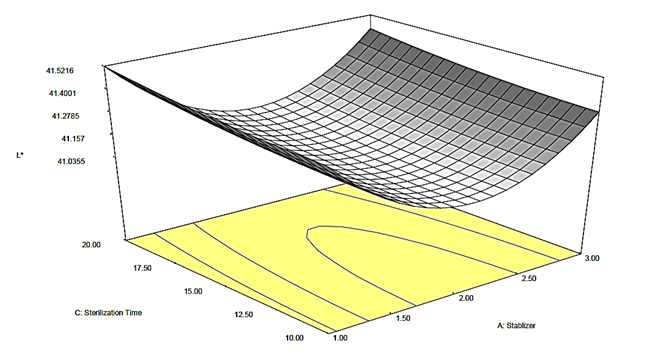
Figure 2b: Response surface plot for the effect of stabilizer and sterilization time on the L* value of canned Ngu
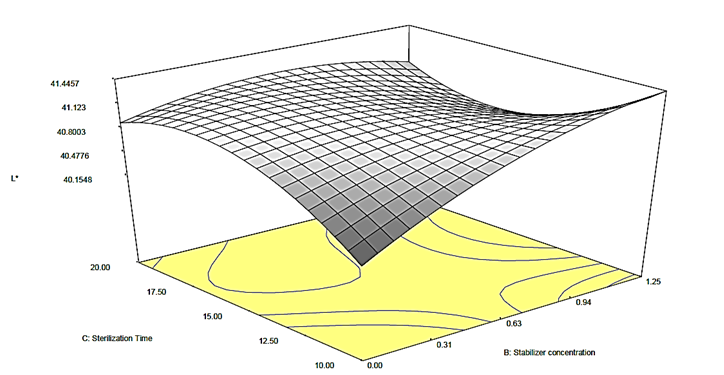
Figure 2c: Response surface plot for the effect of stabilizer concentration and sterilization time on the L* value of canned Ngu
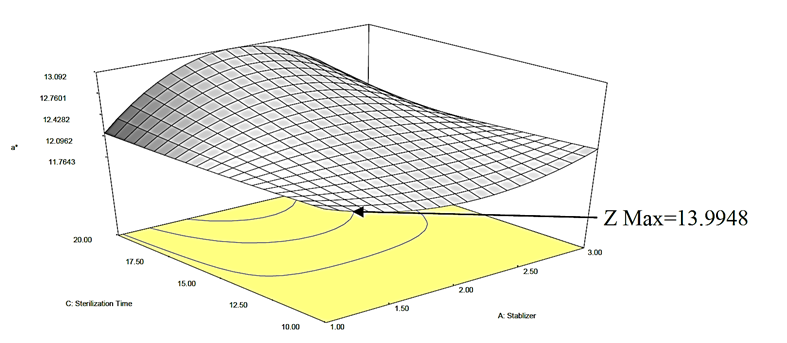
Figure 3a: Response surface plot for the effect of stabilizer concentration and stabilizer on the a* value of canned Ngu
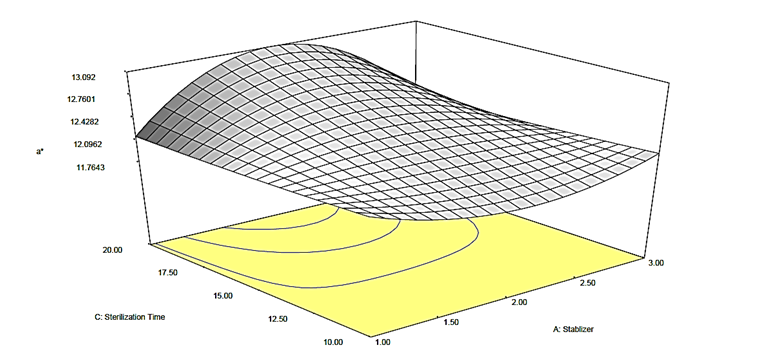
Figure 3b: Response surface plot for the effect of stabilizer and sterilization time on the a* value of canned Ngu
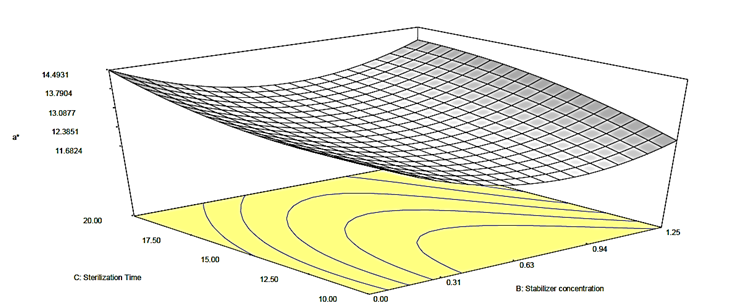
Figure 3c: Response surface plot for the effect of stabilizer concentration and sterilization time on the a* value of canned Ngu
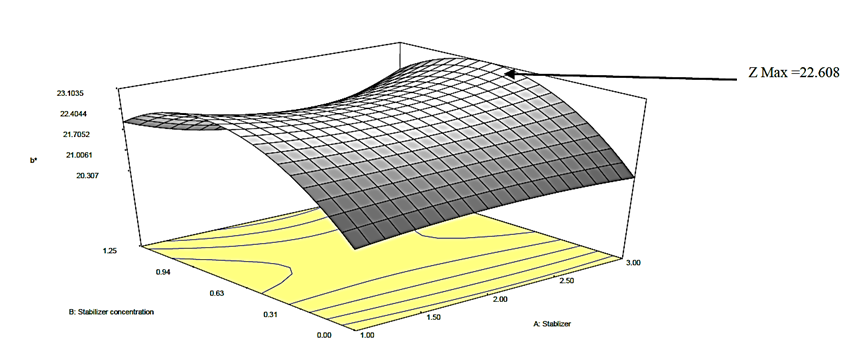
Figure 4a: Response surface plot for the effect of stabilizer concentration and stabilizer on the b* value of canned Ngu
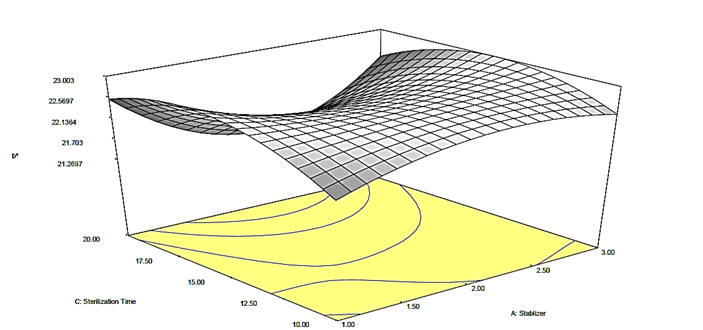
Figure 4b: Response surface plot for the effect of stabilizer and sterilization time on the b* value of canned Ngu
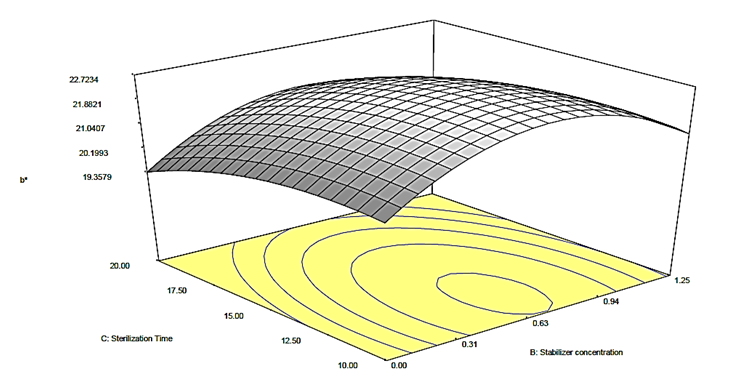
Figure 4c: Response surface plot for the effect of stabilizer concentration and sterilization time on the b* value of canned Ngu
Table 5: Analysis of variance for the total viable count of canned Ngu
Table 6: Analysis of variance for the total fungal count of canned Ngu
Table 7: Analysis of variance for L* value of canned Ngu
Table 8: Analysis of variance for a* value of canned Ngu
Table 9: Analysis of variance for b* value of canned Ngu
M.O. Iwe 1, P.C. Anya 1, S..Ubbor 1, A.N..Agiriga 2*, C..Okoro 1
1. Department of Food Science and Technology, Michael Okpara University of Agriculture, Umudike, Nigeria
2. Department of Food Science and Technology, Federal University Oye-Ekiti, Nigeria
- Increase in sterilization time increased the a* value and decreased the b* value of canned Ngu.
- Change of stabilizer from Carboxyl Methyl Cellulose to Akparata and then to Ofo resulted in increase in L* value, of canned Ngu.
- Total Fungal Count and Total Viable Count value of all the canned Ngu samples were within acceptable limits
| Article type Original article |
ABSTRACT Background: Ngu is an African salad dressing used to improve the stability and shelf life of African salad. The aim of this study was to produce canned Ngu using three stabilizers at various concentrations, constant sterilization temperature, and varied sterilization times. Methods: Ngu (50 L) was prepared from potash using three stabilizers at various concentrations. A three-level factorial response surface design was applied to generate the experimental runs for the production of the canned Ngu. The Ngu emulsion was filled inside 250 ml bottle jars, sterilized at 121 oC at various times, and canned. The color of the canned Ngu was evaluated using the Comission Internationale de l'Eclairage color scale, and its microbiological attributes, Total Viable Count (TVC) and Total Fungal Count was determined with standard procedures. The effect of the stabilizers (Akparata, Ofo, and Carboxyl Methyl Cellulose), stabilizer concentration, and sterilization time on the color and microbial properties of the canned Ngu was assessed. The Statistical Software Design Expert version 8.0.7 was utilized for response surface analysis and derivation of model equation. Results: Increase in sterilization time increased the a* value and decreased the b* value of the canned Ngu. The quadratic effect of stabilizer, stabilizer concentration, and sterilization time indicated that the alteration of stabilizer from Carboxyl Methyl Cellulose to Akparata and then to Ofo increased the L* value, of the canned Ngu. An increase in the quadratic effect of stabilizer concentration increased the a* value but decreased the L* and b* values of the canned Ngu. However, the TVC and b* value of the canned Ngu reduced as the quadratic effects of the sterilization time increased. Conclusion: Total Fungal Count and TVC value of all the canned Ngu samples were within acceptable limits, ensuring the samples safe for human consumption. © 2024, Shahid Sadoughi University of Medical Sciences. This is an open access article under the Creative Commons Attribution 4.0 International License. |
|
| Keywords Emulsions Convenience Food Microbial Concepts Canned Food Bacterial Counts |
||
| Article history Received: 23 Oct 2023 Revised: 15 Jan 2024 Accept: 3 Jun 2024 |
||
| Abbreviations CFU=Colony Forming Units CIE=Comission Internationale de l'Eclairage CMC=Carboxyl Methyl Cellulose TFC=Total Fungal Count TVC=Total Viable Count |
To cite: Iwe M.O., Anya P.C., Ubbor S., Agiriga A.N., Okoro C. (2024). Modelling the color and microbial properties of canned Ngu by response surface method. Journal of Food Quality and Hazards Control. 11: 135-148.
Introduction
Introduction
Ngu is an African salad dressing, an emulsifier–water in oil emulsion. Emulsifiers are included in food products to increase the stability and prolong the shelf life (Amadi and Nwankwo, 2021; Okafor-Elenwo and Imade, 2020). In general “emulsion” is described as a structure created through the dispersion of one of two immiscible liquids within the other one in the form of small droplets (generally oil and water) (Jia-hui et al., 2020; Thakur et al., 2023; Wan et al., 2023). Ngu emulsion is utilized in the preparation and consumption of African salad (Abacha Ncha), bitter yam, and processed oil bean seed (“Ugba”) (Uzodinma et al., 2014). Ngu is produced by a manual mixture of palm oil and water filtrate of plant ash (potash). It is a convenient food, readily accessible, cost-effective food that has the potential to enhance food security and nutritional status. However, it could get contaminated principally due to improper handling and lack of hygiene in the processing/preparation environment, causing it a veritable source of food-borne diseases (Amadi and Nwankwo, 2021). Moreover, Ngu has a very short shelf life as prepared and left in utensils, (Okafor-Elenwo and Imade, 2020). Maintaining food for an extended period of time at a temperature range that promotes microbial proliferation (Time-Temperature abuse) has been reported as a measure which leads to food-borne infections and intoxication by Staphylococcus aureus and Bacillus cereus (Ndraha et al., 2018, 2020). Additionally, Ngu is served cold which makes it a major culprit of food poisoning (Kumar, 2020). Proper preservation is crucial for storing Ngu for an extended period without spoilage and microbial contamination. Canning is a traditional method of food preservation and the process involves cooking the food, and thereafter sealing it in sterilized jars or cans, and boiling the containers for sterilization (Kumar, 2019). In these circumstances, all microbes are killed. . Stabilizers are additives widely used in the food industry (Shao et al., 2020). They can be added to Ngu to enhance the viscosity, influence texture, creaminess, and mouth feel (Kamsiati and Herawati, 2021).
The superficial appearance and color of food are the primary parameters of quality evaluated by consumers, and are thus critical factors for acceptance of the food item by the consumer (Dey and Nagababu, 2022). Despite the existence of various color spaces, the most commonly utilized for measuring color in food is the Comission Internationale de l'Eclairage (CIE) L*, a*, b* color space due to the uniform distribution of colors, and since it is very close to human perception of color (Lozhkin and Kuzmenko, 2021; Sobol et al., 2020). Furthermore, the CIE-L* a* b* system is the most convenient, as it represents a versatile color space in Cartesian coordinates (Blattner, 2020). Response Surface Methodology (RSM) can be modified as a technique that involves complex calculation for optimization process (Weremfo et al., 2023). This approach develops an appropriate experimental design that integrates all independent variables and utilizes the data input from the experiment to ultimately generate a set of equations for theoretical value of an output (Athanasaki et al., 2024). The outputs are obtained from a well-designed regression analysis which is based on the controlled values of independent variables. Thereafter, the dependent variable can be predicted according to the new values of independent variables (Weremfo et al., 2023). The experimental runs generated from central composite response surface designs are reduced enormously compared to the number of runs determined using full factorial design and the obtained results are statistically acceptable (Breig and Luti, 2021).
This research aimed to produce Ngu using three stabilizers- Akparata (Alfzelia africana), Ofo (Detarium microcarpum), and Carboxyl Methyl Cellulose (CMC) at various concentrations, constant sterilization temperature and varied sterilization times. The Ngu was subsequently stabilized, homogenized, and canned. The color of the canned Ngu was determined using the L*, a*, b* color space and its microbial attributes were also analyzed. RSM was employed to derive a model equation which can later be applied for response prediction and the determination of optimal conditions. This study will enhance wider production and canning of Ngu for broader distribution and applications, ultimately making it readily accessible to consumers and Nigerians in diaspora.
Materials and methods
Materials
Ncha ighu (10 kg) was procured from a local professional ncha producer at Eke market, Amuda Isuochi, Umunneochi local government area, Abia State, Nigeria. The stabilizers Akparata and Ofo (10 kg each) were procured from a professional local food processor at Amuda Isuochi, Umunneochi local government area, Abia State, Nigeria. The CMC and the canning jars were purchased from Ariaria market in Aba, Aba South local government area, Abia State, Nigeria. All utilized chemicals/reagents originated from Sigma-Aldrich Co., Ltd. (Steinheim, Germany).
Experimental design
A Central Composite response surface Design (CCD) for K=3 as described by Athanasaki et al. (2024) was used in the equation below:
(1)Where, Y=dependent variable
and =independent variablesK=number of independent variables
=random error termsThirty-two experimental runs were generated based on CCD to study the interactions between factors in addition to identifying significant factors. The three factors considered in this experiment were: type of stabilizer, concentration of stabilizer, and sterilization time. The center point (0, 0, 0) with Akparatta as the stabilizer, 0.63 stabilizer concentration and 15 min sterilization time was replicated five times (Kiwu-Lawrence et al., 2021). The independent variables and levels for the production of canned Ngu are illustrated in Table 1 and the experimental design variable settings for the production of canned Ngu are demonstrated in Table 2.
Table 1: Independent variables and levels for production of canned Ngu
| Independent variables | Variable levels | ||
| -1 | 0 | 1 | |
| Stabilizer X1 | CMC | Akparata | Ofo |
| Stabilizer Concentration (%) X2 | 0.00 | 0.63 | 1.25 |
| Sterilization time (min) X3 | 10 | 15 | 20 |
Table 2: Experimental design for the production of canned Ngu
| Run | Stabilizer | Stabilizer concentration (%) |
Sterilization time (min) |
| 1 | CMC | 0 | 10 |
| 2 | Akparata | 0 | 10 |
| 3 | Ofo | 0 | 10 |
| 4 | CMC | 0.63 | 10 |
| 5 | Akparata | 0.63 | 10 |
| 6 | Ofo | 0.63 | 10 |
| 7 | CMC | 1.25 | 10 |
| 8 | Akparata | 1.25 | 10 |
| 9 | Ofo | 1.25 | 10 |
| 10 | CMC | 0 | 15 |
| 11 | Akparata | 0 | 15 |
| 12 | Ofo | 0 | 15 |
| 13 | CMC | 0.63 | 15 |
| 14 | Akparata | 0.63 | 15 |
| 15 | Ofo | 0.63 | 15 |
| 16 | CMC | 1.25 | 15 |
| 17 | Akparata | 1.25 | 15 |
| 18 | Ofo | 1.25 | 15 |
| 19 | CMC | 0 | 20 |
| 20 | Akparata | 0 | 20 |
| 21 | Ofo | 0 | 20 |
| 22 | CMC | 0.63 | 20 |
| 23 | Akparata | 0.63 | 20 |
| 24 | Ofo | 0.63 | 20 |
| 25 | CMC | 1.25 | 20 |
| 26 | Akparata | 1.25 | 20 |
| 27 | Ofo | 1.25 | 20 |
| 28 | Akparata | 0.63 | 15 |
| 29 | Akparata | 0.63 | 15 |
| 30 | Akparata | 0.63 | 15 |
| 31 | Akparata | 0.63 | 15 |
| 32 | Akparata | 0.63 | 15 |
Production of homogenized and stabilized canned Ngu
Homogenized and stabilized Ngu was prepared in accordance with the procedure of Alakali et al. (2008) and Adheeb-Usaid et al. (2014) with several modifications. Ncha filtrate (10% w/v) was obtained by dissolving 5,000 g ncha ighu in 50 L distilled water and further filtered. The filtrate was mixed with 8,000 g of melted palm oil to acquire the Ngu emulsion. Distinct levels (0.0, 0.63 and 1.25%) of stabilizers (Akparata, Ofo, and CMC), were mixed into the Ngu emulsion according to experimental design. Subsequently, the dissolved stabilizer at each of the concentration was homogenized using a warring blender (Tm-800, China) for 5 min. Each of the concentration was filled into 250 ml bottle jar, maintaining the airspace and sterilized at 121 oC at various times (10, 15, and 20 min). The used Retort was New Life Model NL–50LD Vertical Pressure Steam Sterilizer Series No 18L–1217, made in China. The completed products were allowed to cool, and stored at room temperature for analysis.
Color determination
Color determination was performed using a Konica Minolta Chroma Meter CR-300 (Konica Minolta Sensing Inc., Milton Keynes, UK) following standardization with a white calibration plate. CIE L*, a*, b* system was deployed with the following values: L* -defined as the lightness of the sample ranging from 0 (black) to 100 (white), a* and b* represents two perpendicular color axes, with the values ranging from -60 to +60 in dimensionless values (Lozhkin and Kuzmenko, 2021). Parameter a* as (-) depicts greenness, when (+) represents redness. Whereas b* represents blueness when (-), and yellowness when (+) (Sobol et al., 2020).
Total Viable Count (TVC)
TVC test was conducted to estimate the total number of microorganisms, including bacteria, yeast or mould, in the Ngu samples (Feng, 2022; Vodyakova et al., 2023). Pour plate method as outlined by Onwuka (2018), was utilized. One g of the sample was macerated into 9 ml of ringer's solution and thoroughly mixed through shaking. This was further diluted to achieve concentrations of 10-2 and 10-3. The 0.1 ml dilution (Onwuka, 2018) was transferred from each dilution bottle into the corresponding plate and 15 ml of sterile NutriSelect Plus (70, 148) nutrient agar medium was poured and mixed thoroughly with the inoculums by rocking the plates. The plates were incubated at 38 oC for 24 h after which the colonies were counted and reported as Colony Forming Units (CFU)/g (Feng, 2022; Hasan et al., 2023).
Total Fungal Count (TFC)
A total fungal test was conducted to identify the presence, total count excluding species of fungi in Ngu samples (Krnjaja et al., 2021). The pour plate method as described by Onwuka (2018) was employed. The sample dilution weighing 0.1 ml (Onwuka, 2018) was transferred from each dilution into corresponding plates and 15 ml of sterile NutriSelect Plus (70, 139) Potato Dextrose Agar (PDA) medium was poured and mixed thoroughly with the inoculums by rocking the plates. The plates were incubated at ambient temperature for 72 h, after which the number of colonies formed was counted and expressed in terms of CFU/g.
Statistical analysis
The statistical software Design Expert version 8.0.7 (Stat ease, Inc., Minneapolis, USA) was employed to generate the experimental design matrix and analyze the experimental data. The model was significant at p≤0.05. The terms statistically detected as non-significant were excluded from the model (p≥0.05).
Results
The results of the color of the canned Ngu evaluated using CIE L*, a*, b* which are demonstrated in Table 3. With regard to the obtained result, color of the Ngu emulsions was of average brightness (not too dark and not too bright).
The results of the microbiological analysis of the canned Ngu samples are revealed in Table 4. The five replicated runs in Tables 3 and 4 were explained in the experimental design and illustrated in Table 2.
Table 3: Color properties of canned Ngu
| Run | Stabilizer | Stabilizer Concentration (%) |
Sterilization Time (min) |
L* |
Color a* |
b* |
| 1 | CMC | 0 | 10 | 40.03 | 14.16 | 20.15 |
| 2 | Akparata | 0 | 10 | 40.03 | 14.16 | 20.15 |
| 3 | Ofo | 0 | 10 | 40.03 | 14.16 | 20.15 |
| 4 | CMC | 0.63 | 10 | 41.61 | 12.15 | 21.18 |
| 5 | Akparata | 0.63 | 10 | 41.32 | 11.83 | 22.76 |
| 6 | Ofo | 0.63 | 10 | 41.32 | 12.35 | 22.69 |
| 7 | CMC | 1.25 | 10 | 41.94 | 12.12 | 21.27 |
| 8 | Akparata | 1.25 | 10 | 41.92 | 12.21 | 21.38 |
| 9 | Ofo | 1.25 | 10 | 41.81 | 11.93 | 21.43 |
| 10 | CMC | 0 | 15 | 40.92 | 14.03 | 20.05 |
| 11 | Akparata | 0 | 15 | 40.92 | 14.03 | 20.05 |
| 12 | Ofo | 0 | 15 | 40.92 | 14.03 | 20.05 |
| 13 | CMC | 0.63 | 15 | 41.47 | 12.65 | 22.62 |
| 14 | Akparata | 0.63 | 15 | 41.12 | 12.03 | 22.83 |
| 15 | Ofo | 0.63 | 15 | 41.22 | 12.32 | 22.52 |
| 16 | CMC | 1.25 | 15 | 41.76 | 13.04 | 22.66 |
| 17 | Akparata | 1.25 | 15 | 40.03 | 14.16 | 20.15 |
| 18 | Ofo | 1.25 | 15 | 41.64 | 12.18 | 22.48 |
| 19 | CMC | 0 | 20 | 40.92 | 14.03 | 20.05 |
| 20 | Akparata | 0 | 20 | 40.92 | 14.03 | 20.05 |
| 21 | Ofo | 0 | 20 | 40.92 | 14.03 | 20.05 |
| 22 | CMC | 0.63 | 20 | 41.32 | 12.35 | 22.69 |
| 23 | Akparata | 0.63 | 20 | 40.86 | 14.12 | 20.12 |
| 24 | Ofo | 0.63 | 20 | 41.32 | 11.83 | 22.76 |
| 25 | CMC | 1.25 | 20 | 41.81 | 11.93 | 21.43 |
| 26 | Akparata | 1.25 | 20 | 40.92 | 14.03 | 20.05 |
| 27 | Ofo | 1.25 | 20 | 41.92 | 12.21 | 21.38 |
| 28 | Akparata | 0.63 | 15 | 41.12 | 12.03 | 22.83 |
| 29 | Akparata | 0.63 | 15 | 41.12 | 12.03 | 22.83 |
| 30 | Akparata | 0.63 | 15 | 41.12 | 12.03 | 22.83 |
| 31 | Akparata | 0.63 | 15 | 41.12 | 12.03 | 22.83 |
| 32 | Akparata | 0.63 | 15 | 41.12 | 12.03 | 22.83 |
a* (green/red color component (a*>0 red, a*<0 green)
b* (blue/yellow (b*> 0 yellow, b*<0 blue)
CMC=Carboxyl Methyl Cellulose
Table 4: Microbial properties of canned Ngu
| Run | Stabilizer | Stabilizer concentration (%) |
Sterilization time (min) |
TVC (CFU/g) |
TFC (CFU/g) |
| 1 | CMC | 0 | 10 | 6.75 | 2.00 |
| 2 | Akparata | 0 | 10 | 6.75 | 2.00 |
| 3 | Ofo | 0 | 10 | 6.75 | 2.00 |
| 4 | CMC | 0.63 | 10 | 9.05 | 6.00 |
| 5 | Akparata | 0.63 | 10 | 7.00 | 4.50 |
| 6 | Ofo | 0.63 | 10 | 12.9 | 4.00 |
| 7 | CMC | 1.25 | 10 | 5.95 | 1.50 |
| 8 | Akparata | 1.25 | 10 | 4.60 | 3.00 |
| 9 | Ofo | 1.25 | 10 | 14.85 | 13.00 |
| 10 | CMC | 0 | 15 | 9.55 | 6.00 |
| 11 | Akparata | 0 | 15 | 9.55 | 6.00 |
| 12 | Ofo | 0 | 15 | 9.55 | 6.00 |
| 13 | CMC | 0.63 | 15 | 7.00 | 5.00 |
| 14 | Akparata | 0.63 | 15 | 21.60 | 6.00 |
| 15 | Ofo | 0.63 | 15 | 8.40 | 8.00 |
| 16 | CMC | 1.25 | 15 | 21.60 | 4.00 |
| 17 | Akparata | 1.25 | 15 | 2.95 | 25.50 |
| 18 | Ofo | 1.25 | 15 | 26.40 | 7.00 |
| 19 | CMC | 0 | 20 | 6.85 | 10.00 |
| 20 | Akparata | 0 | 20 | 6.85 | 10.00 |
| 21 | Ofo | 0 | 20 | 6.85 | 10.00 |
| 22 | CMC | 0.63 | 20 | 11.00 | 2.00 |
| 23 | Akparata | 0.63 | 20 | 12.00 | 5.50 |
| 24 | Ofo | 0.63 | 20 | 9.25 | 6.50 |
| 25 | CMC | 1.25 | 20 | 24.00 | 3.00 |
| 26 | Akparata | 1.25 | 20 | 7.70 | 2.00 |
| 27 | Ofo | 1.25 | 20 | 5.75 | - |
| 28 | Akparata | 0.63 | 15 | 21.60 | 4.00 |
| 29 | Akparata | 0.63 | 15 | 21.60 | 4.00 |
| 30 | Akparata | 0.63 | 15 | 21.60 | 4.00 |
| 31 | Akparata | 0.63 | 15 | 21.60 | 4.00 |
| 32 | Akparata | 0.63 | 15 | 21.60 | 4.00 |
CFU=Colony Forming Unit; CMC=Carboxyl Methyl Cellulose; TFC=Total Fungal Count; TVC=Total Viable Count
Analysis of variance results have been added accordingly (Tables 5 to 9). The canned Ngu samples had TFC (2.00 to 25.50 CFU/g) and TVC (2.95 to 26.40 CFU/g) values below the acceptable limits (less than 104 CFU/g) as exhibited in Table 4, hence, they are microbiologically fit for human consumption. Results of the analysis of variance based on TVC and TFC of canned Ngu are observed in Tables 5 and 6, respectively. ANOVA results for the CIE of canned Ngu for L*, a*, and b* are uncovered in Tables 7, 8, and 9, respectively. Optimization was not performed since it is not within the scope of this study. Fresh and frozen fish were excluded from the study.
Following the elimination of insignificant (p>0.05) model terms, the model equation representing the impact of stabilizer (X 1 X 2 X 3
Following the elimination of insignificant (p>0.05) model terms, the model equation representing the impact of stabilizer (
TVC=16.26-6.77 X 3 2  (2)
(2)
The quadratic effect of sterilization time (-X 3 2 X 1 X 3
(2)The quadratic effect of sterilization time (-
Figure 1: Response surface plot for the effect of sterilization time and stabilizer on Total Viable Count (TVC) of canned Ngu
The model was not significant (p>0.05) in analyzing the effect of stabilizer (X 1 X 2 X 3
Figures 2 (a, b, c) declared the surface plot for the effect of stabilizer (X 1 X 2 X 3
) on the b* value of the canned Ngu. From the plots (Figures 4a, b, c), it was observed that alteration of stabilizer state (from CMC to Ofo) led to quadratic increase in the b* value of the canned Ngu. On the account of sterilization time and stabilizer concentration, it was observed that as the magnitude enhanced, the value of b* increased as well, further increase in their magnitude resulted in a decrease in the b* value.
Figures 2 (a, b, c) declared the surface plot for the effect of stabilizer (
) on the b* value of the canned Ngu. From the plots (Figures 4a, b, c), it was observed that alteration of stabilizer state (from CMC to Ofo) led to quadratic increase in the b* value of the canned Ngu. On the account of sterilization time and stabilizer concentration, it was observed that as the magnitude enhanced, the value of b* increased as well, further increase in their magnitude resulted in a decrease in the b* value.
L*=41.07+0.35 X 1 2 X 2 2 X 2 X 3 X 1 2 X 2 X 2 X 3 2  (3)
(3)
Figures 3 (a, b, c) presented that the increase in sterilization time and stabilizer concentration resulted in the quadratic increase in a* value of the canned Ngu. After the elimination of non-significant (p>0.05) model terms, the model equation was:
a*=12.40+0.66 X 3 X 2 2 X 1 2 X 2 X 1 2 X 3  (4)
(4)
The linear effect of the sterilization time (X 3 X 2 2 ) X 3 2 X 1 2 X 2 X 1 2 X 3 2
The model equation following the removal of non-significant model terms was:
(5)
b*=22.52-0.68 X 3 X 2 2 X 3 2 X 1 2 X 2 X 1 2 X 3
Figures 4 (a, b, c) betrayed the surface plots for the effect of stabilizer (X 1  ), stabilizer concentration (
X 2  ), and sterilization time (
X 3 
(3)Figures 3 (a, b, c) presented that the increase in sterilization time and stabilizer concentration resulted in the quadratic increase in a* value of the canned Ngu. After the elimination of non-significant (p>0.05) model terms, the model equation was:
a*=12.40+0.66
(4)The linear effect of the sterilization time (
The model equation following the removal of non-significant model terms was:
(5)
b*=22.52-0.68
Figures 4 (a, b, c) betrayed the surface plots for the effect of stabilizer (
), stabilizer concentration ( ), and sterilization time ( Figure 2a: Response surface plot for the effect of stabilizer concentration and stabilizer on the L* value of canned Ngu
Figure 2b: Response surface plot for the effect of stabilizer and sterilization time on the L* value of canned Ngu
Figure 2c: Response surface plot for the effect of stabilizer concentration and sterilization time on the L* value of canned Ngu
Figure 3a: Response surface plot for the effect of stabilizer concentration and stabilizer on the a* value of canned Ngu
Figure 3b: Response surface plot for the effect of stabilizer and sterilization time on the a* value of canned Ngu
Figure 3c: Response surface plot for the effect of stabilizer concentration and sterilization time on the a* value of canned Ngu
Figure 4a: Response surface plot for the effect of stabilizer concentration and stabilizer on the b* value of canned Ngu
Figure 4b: Response surface plot for the effect of stabilizer and sterilization time on the b* value of canned Ngu
Figure 4c: Response surface plot for the effect of stabilizer concentration and sterilization time on the b* value of canned Ngu
Table 5: Analysis of variance for the total viable count of canned Ngu
| Source | Sum of squares | Degree of freedom | Mean | F value | Probability>F |
| Model | 627.02 | 7 | 89.57 | 2.47 | 0.0461 |
 |
0.059 | 1 | 0.059 | 1.634E-003 | 0.9681 |
 |
9.74 | 1 | 9.74 | 0.27 | 0.609 |
 |
13.61 | 1 | 13.61 | 0.38 | 0.546 |
 |
1.98 | 1 | 1.98 | 0.055 | 0.818 |
 |
340.24 | 1 | 340.24 | 9.40 | 0.005 |
 |
1.70 | 1 | 1.70 | 0.047 | 0.830 |
 |
126.40 | 1 | 126.40 | 3.49 | 0.074 |
| Residual | 868.77 | 24 | 36.20 | ||
| Lack of fit | 868.77 | 24 | 36.20 | ||
| Pure error | 0.000 | 5 | 0.000 |
Table 6: Analysis of variance for the total fungal count of canned Ngu
| Source | Sum of squares | Degree of freedom | Mean | F value | Probability>F |
| Model | 102.13 | 3 | 34.04 | 1.74 | 0.183 |
| |
4.57 | 1 | 4.57 | 0.23 | 0.633 |
| |
12.67 | 1 | 12.67 | 0.65 | 0.429 |
 |
77.31 | 1 | 77.31 | 3.94 | 0.057 |
| Residual | 529.15 | 27 | 19.60 | ||
| Lack of fit | 525.81 | 22 | 23.90 | 35.85 | 0.0004 |
| Pure error | 3.33 | 5 | 0.67 |
Table 7: Analysis of variance for L* value of canned Ngu
| Source | Sum of squares | Degree of freedom | Mean | F value | Probability>F |
| Model | 7.77 | 10 | 0.78 | 11.40 | <0.0001 |
| |
0.026 | 1 | 0.026 | 0.38 | 0.546 |
| |
0.11 | 1 | 0.11 | 1.58 | 0.222 |
| |
0.046 | 1 | 0.046 | 0.68 | 0.418 |
| |
0.86 | 1 | 0.86 | 12.60 | 0.002 |
 |
0.40 | 1 | 0.40 | 5.82 | 0.025 |
| |
2.735E-003 | 1 | 2.735E-003 | 0.040 | 0.843 |
| |
1.692E-003 | 1 | 1.692E-003 | 0.025 | 0.876 |
| |
1.14 | 1 | 1.14 | 16.73 | 0.0005 |
| |
0.73 | 1 | 0.73 | 10.74 | 0.004 |
 |
1.04 | 1 | 1.04 | 15.29 | 0.0008 |
| Residual | 1.43 | 21 | 0.068 | ||
| Lack of fit | 1.43 | 16 | 0.089 | ||
| Pure error | 0.000 | 5 | 0.000 |
Table 8: Analysis of variance for a* value of canned Ngu
| Source | Sum of squares | Degree of freedom | Mean | F value | Probability>F |
| Model | 24.71 | 12 | 2.06 | 8.81 | <0.0001 |
| |
0.11 | 1 | 0.11 | 0.48 | 0.498 |
| |
7.136E-003 | 1 | 7.136 | 7.136E-003 | 0.863 |
| |
2.64 | 1 | 2.64 | 11.28 | 0.003 |
| |
0.78 | 1 | 0.78 | 3.32 | 0.084 |
| |
9.60 | 1 | 9.60 | 41.07 | <0.0001 |
| |
4.441E-003 | 1 | 4.441E-003 | 0.019 | 0.892 |
| |
0.050 | 1 | 0.050 | 0.21 | 0.650 |
 |
5.208E-003 | 1 | 5.208E-003 | 0.022 | 0.883 |
| |
0.44 | 1 | 0.44 | 1.90 | 0.184 |
| |
1.51 | 1 | 1.51 | 6.45 | 0.020 |
 |
1.98 | 1 | 1.98 | 8.49 | 0.009 |
 |
0.61 | 1 | 0.61 | 2.61 | 0.123 |
| Residual | 4.44 | 19 | 0.23 | ||
| Lack of fit | 4.44 | 14 | 0.32 | ||
| Pure error | 0.000 | 5 | 0.000 |
Table 9: Analysis of variance for b* value of canned Ngu
| Source | Sum of squares | Degree of freedom | Mean | F value | Probability>F |
| Model | 38.71 | 10 | 3.87 | 12.31 | <0.0001 |
| |
0.11 | 1 | 0.11 | 0.35 | 0.560 |
| |
0.30 | 1 | 0.30 | 0.95 | 0.341 |
| |
2.76 | 1 | 2.76 | 8.78 | 0.007 |
| |
1.20 | 1 | 1.20 | 3.81 | 0.064 |
| |
20.40 | 1 | 20.40 | 64.90 | <0.0001 |
| |
2.30 | 1 | 2.30 | 7.32 | 0.013 |
| |
3.195E-004 | 1 | 3.195E-004 | 1.016E-003 | 0.975 |
| |
0.23 | 1 | 0.23 | 0.72 | 0.405 |
| |
1.55 | 1 | 1.55 | 4.93 | 0.038 |
| |
2.58 | 1 | 2.58 | 8.19 | 0.009 |
| Residual | 6.60 | 21 | 0.31 | ||
| Lack of fit | 6.60 | 16 | 0.41 | ||
| Pure error | 0.000 | 5 | 0.000 |
Discussion
Color in the food industry is considered as an identifier which is applied by producers and processing engineers as well as consumers (Sobol et al., 2020). It is a meaningful feature as it is one of the initial characteristics to be evaluated by consumers and closely associated with the food quality (Pathare et al., 2013; Wu and Sun, 2013). Color is a frequently measured quality trait of products in postharvest handling and in the food processing research and industry (Pathare et al., 2013). The CIE L*, a*, b* model is utilized for assessing the quality of fruits, vegetables, dairy products, and potatoes (Zielińska and Markowski, 2012).
Color in the food industry is considered as an identifier which is applied by producers and processing engineers as well as consumers (Sobol et al., 2020). It is a meaningful feature as it is one of the initial characteristics to be evaluated by consumers and closely associated with the food quality (Pathare et al., 2013; Wu and Sun, 2013). Color is a frequently measured quality trait of products in postharvest handling and in the food processing research and industry (Pathare et al., 2013). The CIE L*, a*, b* model is utilized for assessing the quality of fruits, vegetables, dairy products, and potatoes (Zielińska and Markowski, 2012).
The impact of sterilization time on L* failed to manifest a consistent pattern except for the zero concentration of stabilizer which intensified as the sterilization time increased. However, as the stabilizer concentration was increased at constant sterilization time, the L* also increased except for Akparata which revealed reduction as the concentration of Akparata was increased from 0.63 to 1.25% at sterilization time of 15 min. In all cases, the L* values ranged from 40.03 to 41.94, suggesting that the emulsions were of average brightness (neither too dark, nor too bright). Nonetheless, Kamsiati and Herawati (2021) reported that the inclusion of stabilizers led to a decrease in the lightness of black pepper sauce.
It was noted that as the sterilization time increased, the L*value of the canned Ngu increased as well. Studies have indicated that the sterilization time can greatly affect the lightness of food. Sevenich et al. (2015) discovered that High Pressure Thermal Sterilization (HPTS) can result in improved food quality and decreased thermal load, potentially influencing the lightness of the food. In addition, Lazárková et al. (2011) detected that various heat sterilization regimes can cause alterations in the sensory properties of processed cheese, which could include modifications in lightness. These studies collectively suggest that the lightness of food can be affected by the sterilization time, method, and conditions.
Furthermore, the L* value rose as the stabilizer concentration increased. The concentration of stabilizers in food products can have a significant impact on their attributes, including lightness (Perez-Santaescolastica et al., 2020). On the account of the stabilizer, a decrease was noticed from CMC to Akparata, further movement from Akparata to Ofo resulted in an increase in the L* value of the canned Ngu. The model is highly significant (p<0.05) in analyzing the effect of stabilizer (X 1 X 2 X 3 X 1 2 ) X 2 2 ) X 2 X 3 X 1 2 X 2 X 2 X 3 2 X 2 2 X 2 X 3
Based on the effect of sterilization time on the a* of the canned Ngu, as the sterilization time increased the a* followed a parabolic path for all the stabilizers and their concentrations except for 0.63% Akparata and 1.25% Ofo stabilizers that displayed an increase in the a* value with a boost in the sterilization time. Maintaining the sterilization time constant and varying the stabilizer concentration, revealed that as the stabilizer concentration rose, the a* value followed a curved path except for Ofo (10 and 15 min sterilization time) and CMC (10 min sterilization time) which unveiled a reduction in the a* value as the stabilizer concentration increased. This aligns with the findings of Kamsiati and Herawati (2021) which disclosed the inclusion of stabilizers reduced the level of redness in black pepper sauce. In terms of color hue, the emulsions had positive a* values from 11.83 to 14.16, which indicate red in color (Sobol et al., 2020). The linear effect of the sterilization time (X 3 X 2 2 ) X 1 2 X 1 2 X 3 2 ) X 1 2 ( X 1 2 X 3 2 ),
The impact of stabilizer concentration on b* content of the canned Ngu followed a curved path for all the stabilizer except for Akparata sterilization time of 20 min where the b* value slightly decreased with higher Akparata concentration although in a negligible manner. In the case of sterilization time effect on the b* concentration of the canned Ngu, a curved shape is also observed for all the samples except for 1.25% Akparata and 0.63% CMC which experienced a decrease and an increase respectively for b* with increase in sterilization time. The b* values were all positive ranging from 20.05 to 22.83, indicating that the emulsions had a yellow hue. In simpler terms, the emulsions all displayed yellow – red hue tending towards yellow due to the b* values being relatively higher than a* values (Lozhkin and Kuzmenko, 2021).
The TVC value of the canned Ngu (Table 4) failed to follow any particular trend as observed for all the stabilizer concentrations with increasing sterilization time except for 1.25% CMC concentrations and sterilization time of 20 min which uncovered an increase with boosting sterilization time and stabilizer concentration. Even though, Akparata, had a significant reduction in TVC (from 7.0 at 0.63% 10 min, to 2.95 at 1.25% 15 min). The depressing rate of TVC with increase in concentration of the local stabilizers (Akparata and Ofo), could suggest that the local stabilizers have anti-microbial effect (Mbaeyi-Nwaoha et al., 2017). However, the canned Ngu is microbiologically fit for human consumption since the plate count is less than the stipulated 1.0×10⁴ CFU/g for plant products (Uneanya et al., 2019). 1.0×10⁴ CFU/g is the microbial limit for plant products whether canned or not.
It was observed that the model term demonstrated an antagonistic effect on the TVC of the canned Ngu. This result contradicts the research conducted by Olurunnisomo et al. (2015) which detected an increase in microbial load of yoghurt with the addition of stabilizers. This could be as a result of the heat treatment subjected to the canned Ngu. It was evident that only sterilization time had a quadratic effect on the TVC. There was a reduction in TVC as the sterilization time increased. Reduced TVC of canned Ngu as compared to that of Ngu sold commercially (195 CFU/ml), as documented by Uzodinma et al. (2014) highlights the reduction of health hazards in using this innovative product as a salad dressing in Africa salad preparations.
The TFC value of the canned Ngu intensified as the sterilization time increased at various concentrations of CMC except for 0.63% CMC and 1.25% Ofo which decreased as the sterilization time increased. Shelf life studies are beyond the scope of our study. For 0.63% Ofo and Akparata, the TFC value followed a parabolic direction with increasing sterilization time. Keeping the sterilization time constant, the value of TFC decreased with increasing stabilizer concentration except for CMC at 10 and 20 min sterilization time, Ofo at 15 min sterilization time, and Akparata at 10 min sterilization time which demonstrated a parabolic shape with increasing stabilizer concentration. Although Ofo at 10 min sterilization time and Akparata at 15 min sterilization time displayed an increase in TFC as stabilizer concentration increased. Exposure time, temperature, the presence of organic matter, food pH, and the nature/concentration of stabilizers are key factors influencing the efficacy of sterilization of canned foods for significant reduction of fungal counts. Hu et al. (2020) concluded that a sterilization time of 0.5-1 h was effective in eliminating arbuscular mycorrhizal fungal colonization. Raits et al. (2021) emphasized the role of food pH in determining the survival of thermophilic bacteria during heat treatment. Sasaki and Yamanaka (2020) proposed a novel method combining a food preservative and low-temperature steaming for the treatment of lignocellulosic biomass, which could potentially be adapted for use in canned food sterilization. The canned Ngu had TFC values below the acceptable limits (<104 CFU/g), for canned and other foods, therefore, it is microbiologically safe for human consumption (Samuel, 2012).
Conclusion
This investigation has proved that Ngu can be transformed into a convenient form (canned) for the benefit of African salad consumers. The CIE L*, a*, b* method is effective in assessing the color of canned Ngu. Based on the microbial studies TFC and TVCs of the samples were within acceptable limits. The local stabilizers had the ability to bind water, thus preventing microbial growth. Moreover, as oil in water emulsion, the samples with the stabilizer failed to separate even after about 4 weeks of production, the products were still stable at room temperature. The results of this project promote the use of natural stabilizer particularly Akparata as a raw material for the development of new food products –canned Ngu (African salad dressing).
Author contributions
C.O. performed the experiments and prepared the manuscript; M.O.I. supervised the work and edited the manuscript; P.C.A. and S.U. conducted the statistical analysis; A.N.A. reviewed and edited the manuscript. All authors read and approved the final manuscript.
Conflicts of interest
All the authors declared that there is no conflict of interest in the study.
Acknowledgements
The authors are grateful to the Food Science and Technology department of the Michael Okpara University of Agriculture, Umudike, Nigeria for providing laboratory assistance to carry out this research
Funding
This project/study received no funding
Ethical consideration
Not applicable. No human or animal was used for the study.
References
Adheeb-Usaid A.S., Premkumar J., Ranganathan T.V. (2014). Emulsion and it’s applications in food processing- a review. International Journal of Engineering Research and Applications. 4: 241-248.
Alakali J.S., Okonkwo T.M., Ordye E.M. (2008). Effect of stabilizers on the physico-chemical and sensory attributes of thermized yoghurt. African Journal of Biotechnology. 7: 158-163.
Amadi L.O., Nwankwo C.C. (2021). Culture-dependent evaluation of microbial and proximate composition of ready-to-eat (RTE) African salad sold at Nkpolu-Oroworukwo Ultra-Modern Market (Mile 3, Diobu), Port Harcourt, Rivers State, Nigeria. South Asian Journal of Research in Microbiology. 9: 32-40. [DOI: 10.9734/sajrm/2021/ v9i330211]
Athanasaki D.E., Georgiou S.D., Stylianou S. (2024). New approaches on composite designs for response surface methodology. Plos One. 19: e0301049. [DOI: 10.1371/ journal.pone.0301049]
Blattner P. (2020). Present and future activities of the International Commission on Illumination (CIE). Light and Engineering. 28: 4-8. [DOI: 10.33383/2020-036]
Breig S.J.M, Luti K.J.K. (2021). Response surface methodology: a review on its applications and challenges in microbial cultures. Materials Today: Proceedings. 42: 2277-2284 [DOI: 10.1016/J.MATPR.2020.12.316]
Dey S., Nagababu B.H. (2022). Applications of food color and bio-preservatives in the food and its effect on the human health. Food Chemistry Advances.1: 100019. [DOI: 10. 1016/j.focha.2022.100019]
Feng C.H. (2022). Quality evaluation and mathematical modelling approach to estimate the growth parameters of total viable count in sausages with different casings. Foods. 11: 634. [DOI: 10.3390/foods11050634]
Hasan M.R., Hossain M.M., Islam M.S., Sunny A.R., Ferdus J., Chowdhury M.Z.A., Mazed M.A., Al Shiam S.A., Mojumder M.A.N., Rahman M.A., Hamid S.M.A., Sultana A. (2023). Seasonal variation of quality and the total viable count of lean and fatty fish. Egyptian Journal of Aquatic Biology and Fisheries. 27: 1337-1356. [DOI: 10.21608/ejabf.2023. 324732]
Hu W., Wei S., Chen H., Tang M. (2020). Effect of sterilization on arbuscular mycorrhizal fungal activity and soil nutrient status. Journal of Soil Science and Plant Nutrition. 20: 684-689. [DOI: 10.1007/s42729-019-00156-2]
Jia-hui Z., Bei-lei C., Qian W., Chun-xia S., Nan Y. (2020). Study on the salad dressing based on natural oil body-sodium alginate. Science and Technology of Food. 41: 7-14. [DOI: 10.13386/j.issn1002-0306.2020.11.002]
Kamsiati E., Herawati H. (2021). Effect of stabilizer type and concentration on the characteristics of black pepper sauce. IOP Conference Series: Earth and Environmental Science. 653: 012104. [DOI: 10.1088/1755-1315/653/1/012104]
Krnjaja V.S., Stanojković A., Petrović T.S., Mandić V., Bijelić Z., Radović Č., Delic N. (2021). Fungal contamination of pig farm feeds. Biotechnology in Animal Husbandry. 37: 139-147. [DOI: 10.2298/BAH2102139K]
Kumar A. (2020). Food poisoning: causes, precautions, diagnosis and treatment: a brief review. World Journal of Biology and Biotechnology. 5: 33-36. [DOI: 10.33865/wjb.005.01.0287]
Kumar A. (2019). Food preservation: traditional and modern techniques. Acta Scientific Nutritional Health. 3: 45-49. [DOI: 10.31080/ASNH.2019.03.0529]
Lawrence K., Chinenye F., Kiwu L.C., Bartholomew D.C., Obite C.P., Chikereuba A.F. (2021). Evaluation and comparison of three classes of central composite designs. Asian Journal of Probability and Statistics. 13: 31-47. [DOI: 10.9734/ajpas/ 2021/v13i230304]
Lazárková Z., Buňka F., Buňková L., Holáň F., Kráčmar S., Hrabe J. (2011). The effect of different heat sterilization regimes on the quality of canned processed cheese. Journal of Food Process Engineering. 34: 1860-1878. [DOI: 10.1111/J.1745-4530.2009.00376.X]
Lozhkin L.D., Kuzmenko A.A. (2021). Investigation of CIE color spaces for differences in color differentiation thresholds in different regions of the color locus. Physics of Wave Processes and Radio Systems. 24: 107-110. [DOI: 10.18469/1810-3189.2021.24.3.107-110]
Mbaeyi-Nwaoha I.E., Nnagbo C.I., Obodoechi C.M., Nweze B.C., Okonkwo T.M. (2017). Production and evaluation of yoghurt contained local stabilizer – Brachysiegia wurocoma (‘Achi’) and Detarium microcarpum (‘Ofo’). International Journal of Biotechnology and Food Science. 5: 23-31.
Ndraha N., Hsiao H., Vlajic J., Yang M.F., Lin H.T.V. (2018). Time-temperature abuse in the food cold chain: review of issues, challenges, and recommendations. Food Control. 89: 12-21. [DOI: 10.1016/j.foodcont.2018.01.027]
Ndraha N., Vlajic J., Chang C.-C., Hsiao H.-I. (2020). Challenges with food waste management in the food cold chains. In: Kosseva M.R., Webb C. (Editors). Food industry wastes. 2nd edition. Academic Press, Manchester. pp: 467-483. [DOI: 10.1016/B978-0-12-817121-9.00022-X]
Okafor-Elenwo E.J., Imade O.S. (2020). Ready‐to‐eat vegetable salads served in Nigerian restaurants: a potential source of multidrug‐resistant bacteria. Journal of Applied Microbiology. 129: 1402-1409. [DOI: 10.1111/ jam. 14693]
Onwuka G.I. (2018). Food analysis and instrumentation. 2nd edition. Theory and Practice, Naphtali Prints, Lagos, Nigeria .pp 115-119.
Pathare P.B., Opara U.L., Al-Julanda A.L., Said F. (2013). Color measurement and analysis in fresh and processed foods: a review. Food and Bioprocess Technology. 6: 36-60. [DOI: 10.1007/s11947-012-0867-9]
Perez-Santaescolastica C., Goemaere O., Hanskens J., Lorenzo J.M., Fraeye I. (2020). Effect of stabiliser classes (animal proteins, vegetable proteins, starches, hydrocolloids and dietary fibre) on the physicochemical properties of a model lean meat product. International Journal of Food Science and Technology. 55: 970-977. [DOI: 10.1111/ijfs.14354]
Raits E., Raita S., Kirse-Ozolina A., Muizniece-Brasava S. (2021). Theoretical and experimental investigation of the thermal inactivation of Thermoanaerobacterium thermosaccharolyticum and Geobacillus stearothermophilus in different canned food matrices. Rural Sustainability Research. 46: 97-104. [DOI: 10.2478/plua-2021-0021]
Samuel O.O. (2012). Bacteriological quality and safety of street vended foods in Delta State, Nigeria. Journal of Biology, Agriculture and Healthcare. 2: 114-119.
Sasaki C., Yamanaka S. (2020). Novel sterilization method combining food preservative use and low temperature steaming for treatment of lignocellulosic biomass with white rot fungi. Industrial Crops and Products. 155: 112765. [DOI: 10.1016/j.indcrop.2020.112765]
Sevenich R., Bark F., Kleinstueck E., Crews C., Pye C., Hradecký J., Reineke K., Lavilla M., Martínez-de-Marañón I., Briand J.C., Knorr D. (2015). The impact of high pressure thermal sterilization on the microbiological stability and formation of food processing contaminants in selected fish systems and baby food puree at pilot scale. Food Control. 50: 539-547. [DOI: 10.1016/J.FOODCONT.2014.09.050]
Shao P., Feng J., Sun P., Xiang N., Lu B., Qiu D. (2020). Recent advances in improving stability of food emulsion by plant polysaccharides. Food Research International. 137: 109376. [DOI: 10.1016/j.foodres.2020.109376]
Sobol Z., Jakubowski T., Nawara P. (2020). The effect of UV-C stimulation of potato tubers and soaking of potato strips in water on color and analyzed color by CIE L*a*b*. Sustainability. 12: 3487. [DOI: 10.3390/su12083487]
Thakur R., Sharma A., Verma P., Asha Devi A. (2023). A review on pharmaceutical emulsion. Asian Journal of Pharmaceutical Research and Development. 11: 143-147. [DOI: 10.22270/ajprd.v11i3.0000]
Uneanya G.C., Ohaegbulam P.O., Anyanwu V.C. (2019). Proximate composition and microbial evaluation of African salad hawked in Owerri (Ihiagwa, Naze and Nekede). Proceedings of 1st International Conference of Industrial and Applied Sciences. pp. 76-81. URL: https://www.researchgate. net/ profile/Promise-Ohaegbulam/publication/ 342851651_ Proximate_Composition_and_Microbial_Evaluation_of_African_salad_hawked_in_Owerri_Ihiagwa_Naze_and_Nekede/links/5f08d8bf92851c52d62756c5/Proximate-Composition-and-Microbial-Evaluation-of-African-salad-hawked-in-Owerri-Ihiagwa-Naze-and-Nekede.pdf.
Uzodinma E.O., Onweluzo J.C., Abugu S.N. (2014). Production and evaluation of instant emulsion base (ncha) from oil palm biogenic waste. African Journal of Biotechnology. 13: 4529-4535. [DOI: 10.5897/AJB2014.13717]
Vodyakova M.A., Pokrovsky N.S., Melnikova E.V., Merkulov V.A. (2023). Recommendations for validation of automated viable cell counting methods (review). Drug Development and Registration. 12: 217-222. [DOI: 10.33380/2305-2066-2023-12-4-1424]
Wan C., Cheng Q., Zeng M., Huang C. (2023). Recent progress in emulsion gels: from fundamentals to applications. Soft Matter. 19: 1282-1292. [DOI: 10.1039/D2SM01481E]
Weremfo A., Abassah-Oppong S., Adulley F., Dabie K., Seidu-Larry S. (2022). Response surface methodology as a tool to optimize the extraction of bioactive compounds from plant sources. Journal of the Science of Food and Agriculture. 103: 26-36. [DOI: 10.1002/jsfa.12121]
Wu D., Sun D.-W. (2013). Color measurements by computer vision for food quality control - a review. Trends in Food Science and Technology. 29: 5-20. [DOI: 10.1016/j.tifs. 2012.08.004]
Zielińska M., Markowski M. (2012). Color characteristics of carrots; effect of drying and rehydration. International Journal of Food Properties. 15: 450-466. [DOI: 10.1080/10942912.2010.489209]
* Corresponding author (A.N. Agiriga)
* E-mail: favoured4sure@gmail.com
ORCID ID: https://orcid.org/0000-0002-9635-0923
* E-mail: favoured4sure@gmail.com
ORCID ID: https://orcid.org/0000-0002-9635-0923
Type of Study: Original article |
Subject:
Special
Received: 23/10/23 | Accepted: 24/06/03 | Published: 24/06/30
Received: 23/10/23 | Accepted: 24/06/03 | Published: 24/06/30
References
1. Adheeb-Usaid A.S., Premkumar J., Ranganathan T.V. (2014). Emulsion and it's applications in food processing- a review. International Journal of Engineering Research and Applications. 4: 241-248.
2. Alakali J.S., Okonkwo T.M., Ordye E.M. (2008). Effect of stabilizers on the physico-chemical and sensory attributes of thermized yoghurt. African Journal of Biotechnology. 7: 158-163.
3. Amadi L.O., Nwankwo C.C. (2021). Culture-dependent evaluation of microbial and proximate composition of ready-to-eat (RTE) African salad sold at Nkpolu-Oroworukwo Ultra-Modern Market (Mile 3, Diobu), Port Harcourt, Rivers State, Nigeria. South Asian Journal of Research in Microbiology. 9: 32-40. [DOI: 10.9734/sajrm/2021/ v9i330211] [DOI:10.9734/sajrm/2021/v9i330211]
4. Athanasaki D.E., Georgiou S.D., Stylianou S. (2024). New approaches on composite designs for response surface methodology. Plos One. 19: e0301049. [DOI: 10.1371/ journal.pone.0301049] [DOI:10.1371/journal.pone.0301049] [PMID] [PMCID]
5. Blattner P. (2020). Present and future activities of the International Commission on Illumination (CIE). Light and Engineering. 28: 4-8. [DOI: 10.33383/2020-036] [DOI:10.33383/2020-036]
6. Breig S.J.M, Luti K.J.K. (2021). Response surface methodology: a review on its applications and challenges in microbial cultures. Materials Today: Proceedings. 42: 2277-2284 [DOI: 10.1016/J.MATPR.2020.12.316] [DOI:10.1016/j.matpr.2020.12.316]
7. Dey S., Nagababu B.H. (2022). Applications of food color and bio-preservatives in the food and its effect on the human health. Food Chemistry Advances.1: 100019. [DOI: 10. 1016/j.focha.2022.100019] [DOI:10.1016/j.focha.2022.100019]
8. Feng C.H. (2022). Quality evaluation and mathematical modelling approach to estimate the growth parameters of total viable count in sausages with different casings. Foods. 11: 634. [DOI: 10.3390/foods11050634] [DOI:10.3390/foods11050634] [PMID] [PMCID]
9. Hasan M.R., Hossain M.M., Islam M.S., Sunny A.R., Ferdus J., Chowdhury M.Z.A., Mazed M.A., Al Shiam S.A., Mojumder M.A.N., Rahman M.A., Hamid S.M.A., Sultana A. (2023). Seasonal variation of quality and the total viable count of lean and fatty fish. Egyptian Journal of Aquatic Biology and Fisheries. 27: 1337-1356. [DOI: 10.21608/ejabf.2023. 324732] [DOI:10.21608/ejabf.2023.324732]
10. Hu W., Wei S., Chen H., Tang M. (2020). Effect of sterilization on arbuscular mycorrhizal fungal activity and soil nutrient status. Journal of Soil Science and Plant Nutrition. 20: 684-689. [DOI: 10.1007/s42729-019-00156-2] [DOI:10.1007/s42729-019-00156-2]
11. Jia-hui Z., Bei-lei C., Qian W., Chun-xia S., Nan Y. (2020). Study on the salad dressing based on natural oil body-sodium alginate. Science and Technology of Food. 41: 7-14. [DOI: 10.13386/j.issn1002-0306.2020.11.002]
12. Kamsiati E., Herawati H. (2021). Effect of stabilizer type and concentration on the characteristics of black pepper sauce. IOP Conference Series: Earth and Environmental Science. 653: 012104. [DOI: 10.1088/1755-1315/653/1/012104] [DOI:10.1088/1755-1315/653/1/012104]
13. Krnjaja V.S., Stanojković A., Petrović T.S., Mandić V., Bijelić Z., Radović Č., Delic N. (2021). Fungal contamination of pig farm feeds. Biotechnology in Animal Husbandry. 37: 139-147. [DOI: 10.2298/BAH2102139K] [DOI:10.2298/BAH2102139K]
14. Kumar A. (2020). Food poisoning: causes, precautions, diagnosis and treatment: a brief review. World Journal of Biology and Biotechnology. 5: 33-36. [DOI: 10.33865/wjb.005.01.0287] [DOI:10.33865/wjb.005.01.0287]
15. Kumar A. (2019). Food preservation: traditional and modern techniques. Acta Scientific Nutritional Health. 3: 45-49. [DOI: 10.31080/ASNH.2019.03.0529] [DOI:10.31080/ASNH.2019.03.0529]
16. Lawrence K., Chinenye F., Kiwu L.C., Bartholomew D.C., Obite C.P., Chikereuba A.F. (2021). Evaluation and comparison of three classes of central composite designs. Asian Journal of Probability and Statistics. 13: 31-47. [DOI: 10.9734/ajpas/ 2021/v13i230304] [DOI:10.9734/ajpas/2021/v13i230304]
17. Lazárková Z., Buňka F., Buňková L., Holáň F., Kráčmar S., Hrabe J. (2011). The effect of different heat sterilization regimes on the quality of canned processed cheese. Journal of Food Process Engineering. 34: 1860-1878. [DOI: 10.1111/J.1745-4530.2009.00376.X] [DOI:10.1111/j.1745-4530.2009.00376.x]
18. Lozhkin L.D., Kuzmenko A.A. (2021). Investigation of CIE color spaces for differences in color differentiation thresholds in different regions of the color locus. Physics of Wave Processes and Radio Systems. 24: 107-110. [DOI: 10.18469/1810-3189.2021.24.3.107-110] [DOI:10.18469/1810-3189.2021.24.3.107-110]
19. Mbaeyi-Nwaoha I.E., Nnagbo C.I., Obodoechi C.M., Nweze B.C., Okonkwo T.M. (2017). Production and evaluation of yoghurt contained local stabilizer - Brachysiegia wurocoma ('Achi') and Detarium microcarpum ('Ofo'). International Journal of Biotechnology and Food Science. 5: 23-31.
20. Ndraha N., Hsiao H., Vlajic J., Yang M.F., Lin H.T.V. (2018). Time-temperature abuse in the food cold chain: review of issues, challenges, and recommendations. Food Control. 89: 12-21. [DOI: 10.1016/j.foodcont.2018.01.027] [DOI:10.1016/j.foodcont.2018.01.027]
21. Ndraha N., Vlajic J., Chang C.-C., Hsiao H.-I. (2020). Challenges with food waste management in the food cold chains. In: Kosseva M.R., Webb C. (Editors). Food industry wastes. 2nd edition. Academic Press, Manchester. pp: 467-483. [DOI: 10.1016/B978-0-12-817121-9.00022-X] [DOI:10.1016/B978-0-12-817121-9.00022-X]
22. Okafor-Elenwo E.J., Imade O.S. (2020). Ready‐to‐eat vegetable salads served in Nigerian restaurants: a potential source of multidrug‐resistant bacteria. Journal of Applied Microbiology. 129: 1402-1409. [DOI: 10.1111/ jam. 14693] [DOI:10.1111/jam.14693] [PMID]
23. Onwuka G.I. (2018). Food analysis and instrumentation. 2nd edition. Theory and Practice, Naphtali Prints, Lagos, Nigeria .pp 115-119.
24. Pathare P.B., Opara U.L., Al-Julanda A.L., Said F. (2013). Color measurement and analysis in fresh and processed foods: a review. Food and Bioprocess Technology. 6: 36-60. [DOI: 10.1007/s11947-012-0867-9] [DOI:10.1007/s11947-012-0867-9]
25. Perez-Santaescolastica C., Goemaere O., Hanskens J., Lorenzo J.M., Fraeye I. (2020). Effect of stabiliser classes (animal proteins, vegetable proteins, starches, hydrocolloids and dietary fibre) on the physicochemical properties of a model lean meat product. International Journal of Food Science and Technology. 55: 970-977. [DOI: 10.1111/ijfs.14354] [DOI:10.1111/ijfs.14354]
26. Raits E., Raita S., Kirse-Ozolina A., Muizniece-Brasava S. (2021). Theoretical and experimental investigation of the thermal inactivation of Thermoanaerobacterium thermosaccharolyticum and Geobacillus stearothermophilus in different canned food matrices. Rural Sustainability Research. 46: 97-104. [DOI: 10.2478/plua-2021-0021] [DOI:10.2478/plua-2021-0021]
27. Samuel O.O. (2012). Bacteriological quality and safety of street vended foods in Delta State, Nigeria. Journal of Biology, Agriculture and Healthcare. 2: 114-119.
28. Sasaki C., Yamanaka S. (2020). Novel sterilization method combining food preservative use and low temperature steaming for treatment of lignocellulosic biomass with white rot fungi. Industrial Crops and Products. 155: 112765. [DOI: 10.1016/j.indcrop.2020.112765] [DOI:10.1016/j.indcrop.2020.112765]
29. Sevenich R., Bark F., Kleinstueck E., Crews C., Pye C., Hradecký J., Reineke K., Lavilla M., Martínez-de-Marañón I., Briand J.C., Knorr D. (2015). The impact of high pressure thermal sterilization on the microbiological stability and formation of food processing contaminants in selected fish systems and baby food puree at pilot scale. Food Control. 50: 539-547. [DOI: 10.1016/J.FOODCONT.2014.09.050] [DOI:10.1016/j.foodcont.2014.09.050]
30. Shao P., Feng J., Sun P., Xiang N., Lu B., Qiu D. (2020). Recent advances in improving stability of food emulsion by plant polysaccharides. Food Research International. 137: 109376. [DOI: 10.1016/j.foodres.2020.109376] [DOI:10.1016/j.foodres.2020.109376] [PMID]
31. Sobol Z., Jakubowski T., Nawara P. (2020). The effect of UV-C stimulation of potato tubers and soaking of potato strips in water on color and analyzed color by CIE L*a*b*. Sustainability. 12: 3487. [DOI: 10.3390/su12083487] [DOI:10.3390/su12083487]
32. Thakur R., Sharma A., Verma P., Asha Devi A. (2023). A review on pharmaceutical emulsion. Asian Journal of Pharmaceutical Research and Development. 11: 143-147. [DOI: 10.22270/ajprd.v11i3.0000] [DOI:10.22270/ajprd.v11i3.1181]
33. Uneanya G.C., Ohaegbulam P.O., Anyanwu V.C. (2019). Proximate composition and microbial evaluation of African salad hawked in Owerri (Ihiagwa, Naze and Nekede). Proceedings of 1st International Conference of Industrial and Applied Sciences. pp. 76-81. URL: https://www.researchgate. net/ profile/Promise-Ohaegbulam/publication/ 342851651_ Proximate_Composition_and_Microbial_Evaluation_of_African_salad_hawked_in_Owerri_Ihiagwa_Naze_and_Nekede/links/5f08d8bf92851c52d62756c5/Proximate-Composition-and-Microbial-Evaluation-of-African-salad-hawked-in-Owerri-Ihiagwa-Naze-and-Nekede.pdf.
34. Uzodinma E.O., Onweluzo J.C., Abugu S.N. (2014). Production and evaluation of instant emulsion base (ncha) from oil palm biogenic waste. African Journal of Biotechnology. 13: 4529-4535. [DOI: 10.5897/AJB2014.13717] [DOI:10.5897/AJB2014.13717]
35. Vodyakova M.A., Pokrovsky N.S., Melnikova E.V., Merkulov V.A. (2023). Recommendations for validation of automated viable cell counting methods (review). Drug Development and Registration. 12: 217-222. [DOI: 10.33380/2305-2066-2023-12-4-1424] [DOI:10.33380/2305-2066-2023-12-4-1424]
36. Wan C., Cheng Q., Zeng M., Huang C. (2023). Recent progress in emulsion gels: from fundamentals to applications. Soft Matter. 19: 1282-1292. [DOI: 10.1039/D2SM01481E] [DOI:10.1039/D2SM01481E] [PMID]
37. Weremfo A., Abassah-Oppong S., Adulley F., Dabie K., Seidu-Larry S. (2022). Response surface methodology as a tool to optimize the extraction of bioactive compounds from plant sources. Journal of the Science of Food and Agriculture. 103: 26-36. [DOI: 10.1002/jsfa.12121] [DOI:10.1002/jsfa.12121] [PMID]
38. Wu D., Sun D.-W. (2013). Color measurements by computer vision for food quality control - a review. Trends in Food Science and Technology. 29: 5-20. [DOI: 10.1016/j.tifs. 2012.08.004] [DOI:10.1016/j.tifs.2012.08.004]
39. Zielińska M., Markowski M. (2012). Color characteristics of carrots; effect of drying and rehydration. International Journal of Food Properties. 15: 450-466. [DOI: 10.1080/10942912.2010.489209] [DOI:10.1080/10942912.2010.489209]
| Rights and permissions | |
 |
This work is licensed under a Creative Commons Attribution-NonCommercial 4.0 International License. |
